Monitoring a Kubernetes Workload
All available services / Kubernetes workloads are displayed in the list on the administration start page. The list of services will help you to check the details for a workload at first sight:
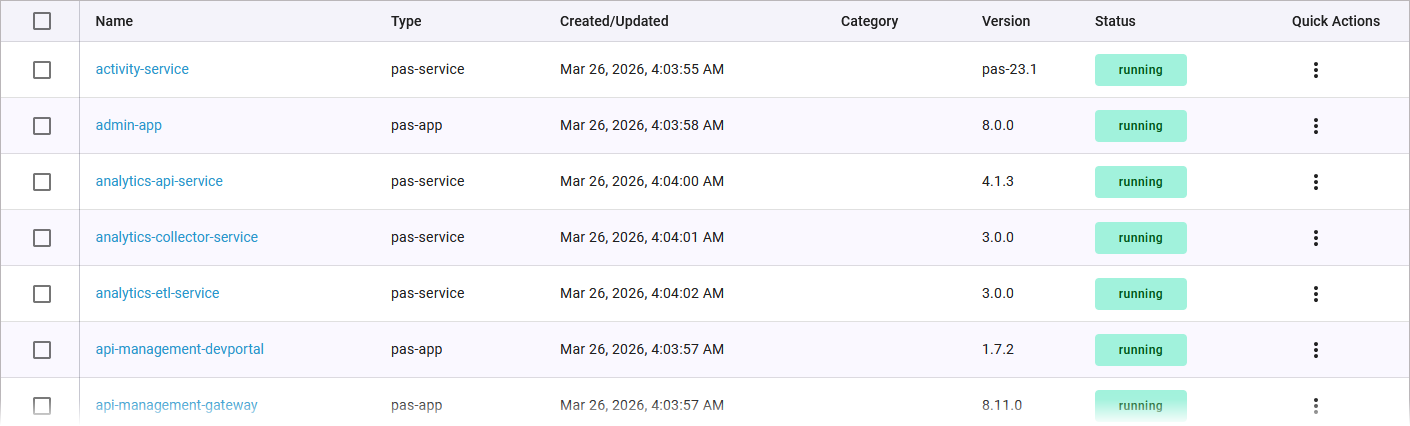
For each workload, the list shows the following information:
|
Column Name |
Description |
Possible Values |
|---|---|---|
|
Name |
Name of the service. Click on the name to access the service details page. |
any string |
|
Type |
Indicates the type of the service. Services of the xuml-service type have some special features, refer to chapter Controlling Containerized xUML Services (Kubernetes) for all details. What is the difference between pas-app and pas-service?
|
Other service types may be displayed. |
|
Created/Updated |
Shows the date and time of the last update of the service. If the service has not been updated yet, its creation date is displayed. |
Datetime in format dd.mm.yyyy, hh:mm:ss |
|
Category |
Displays the category of the service as specified by its creator. |
any string |
|
Version |
Version tag of the default container defined in the workload. For xUML services, the version of the used Runtime is also displayed. |
any string |
|
Status |
Indicates the status of the service. The status is continously updated without refreshing the page. |
The color of the label indicates the following:
Hover over an error state label to get more information about the error.
|
|
Quick Actions |
||
Starting and Stopping a Workload
In the last column of the service list, you will find quick actions for each service. They grant direct access to the applicable actions for this service:
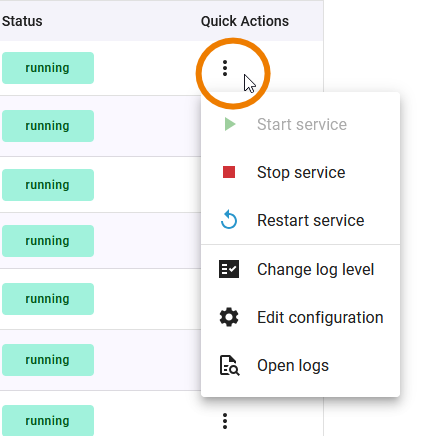
The quick actions for starting, stopping, and restarting a service are also displayed in the header of each details page:
|
Icon |
Description |
|---|---|
|
|
Start a workload, that is currently stopped. |
|
|
Stop a running workload. |
|
|
Stop a running workload and restart it. |
Only applicable actions are enabled.
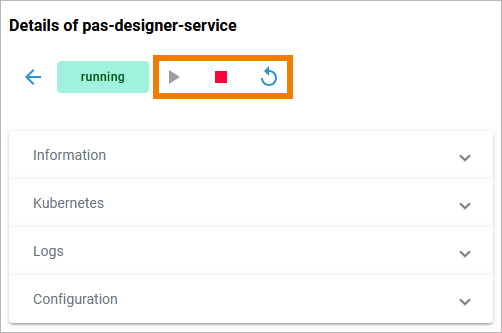
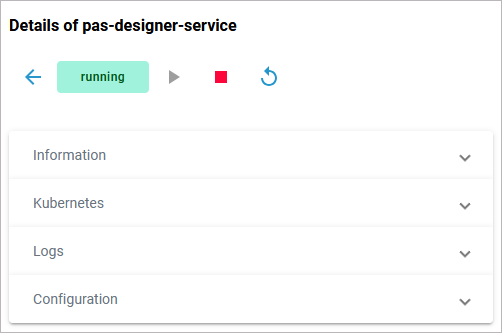
Using the Workload Details
You can open a details page for each workload. To do so, click on the service name in the list:
The details page of a service shows you the title of the service and some quick actions:
|
Icon |
Description |
|---|---|
|
|
Indicates the current state of the service. |
|
|
Indicates whether tracing is enabled for a service in the Analyzer. |
|
|
Starts the service. |
|
|
Stops the service. |
|
|
Restarts the service. |
It also contains multiple collapsable sections:
-
History Log (only for workloads of type ai-agent)
Refer to Controlling Containerized xUML Services (Kubernetes) for an overview on the available details of a containerized xUML service.
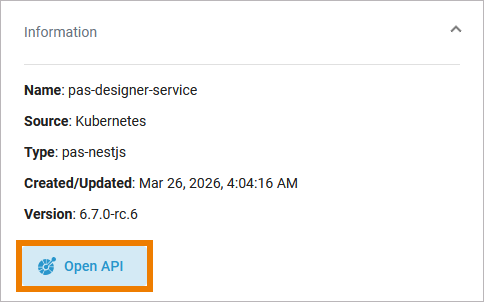
Information
The Information section contains the main information about the Kubernetes workload:
-
Name
-
Source is Kubernetes for workloads
-
Type
-
Created/Updated
-
Version
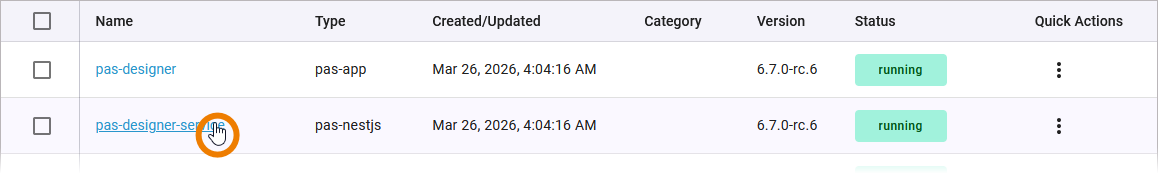
For services of type pas-nestjs, the information section also contains the button Open API. Use it to switch to the service API:
Kubernetes
On top of the Kubernetes section, you find the information about
-
API Version: Defines the versioned schema of this representation of a Kubernetes workload.
-
Labels: Map of string keys and values that can be used to organize and categorize (scope and select) workloads.
-
Annotations: Unstructured key value map stored with a resource that may be set by external tools to store and retrieve arbitrary metadata.
Click Show all to display all available labels or annotations:
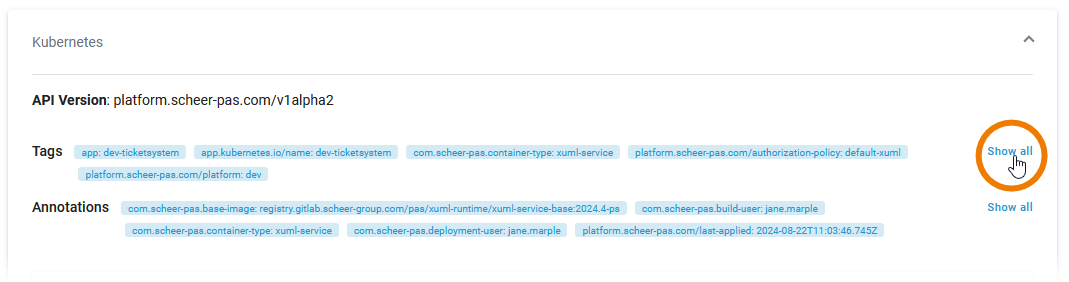
Below this information, you can find the two tabs Pod and Networking:
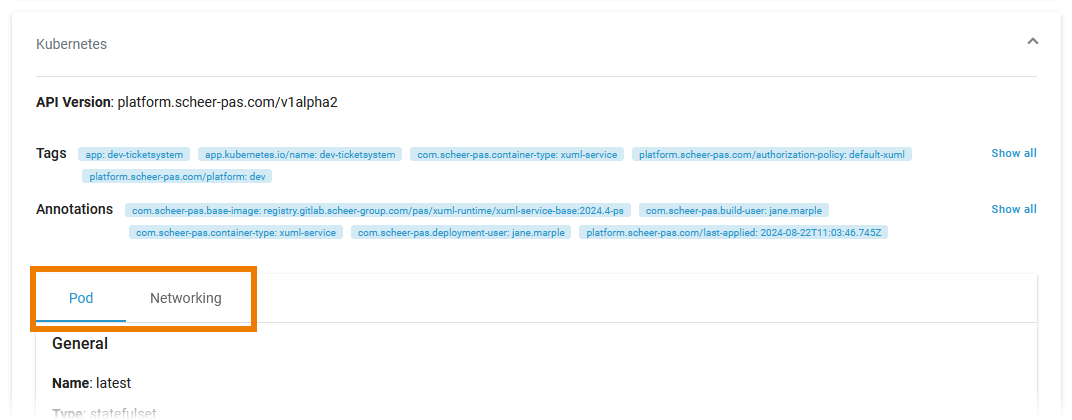
Pod
Tab Pod contains the sections General and Container. The information displayed in the two sections is read-only.
Pod - General
Section General contains common information about the Pod:
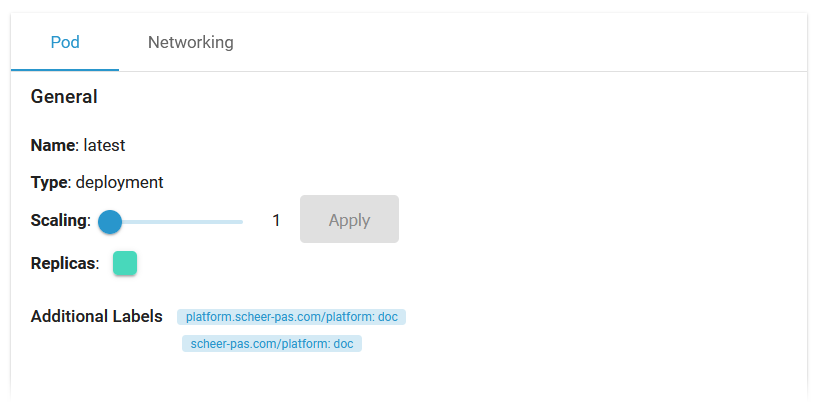
|
Name |
Version name of the Pod. |
|---|---|
|
Type |
Shows the internal type of the replication controller. |
|
Scaling |
If available, you can adapt the number of Pod replicas (see below). |
|
Replicas |
Shows the number of Pod replicas. The color indicates the status:
|
|
Additional Labels |
Shows additional Pod labels if set. |
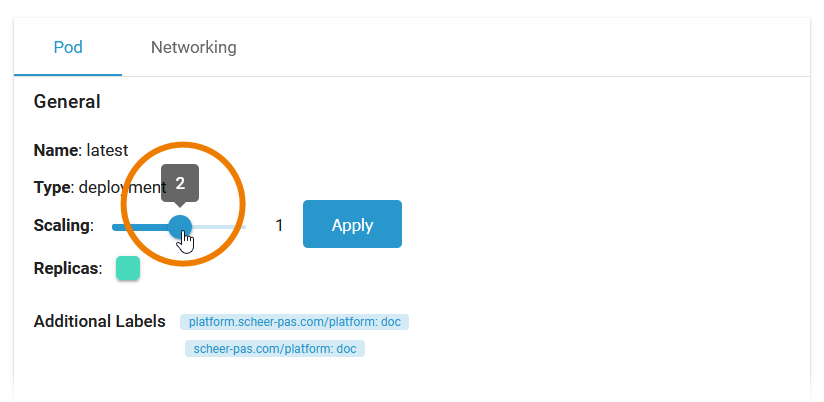
To scale the number of replicas, move the position of the slider to the desired number of replicas you want to set. Click Apply:
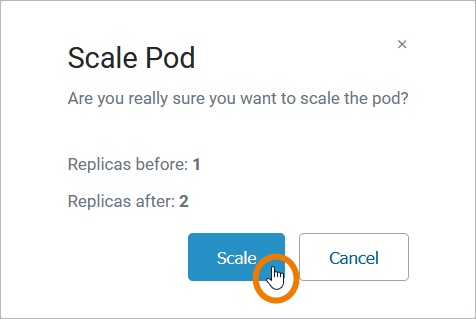
A pop-up window opens displaying the number of replicas before and after the change. Click Scale to confirm your choice or Cancel to abort:
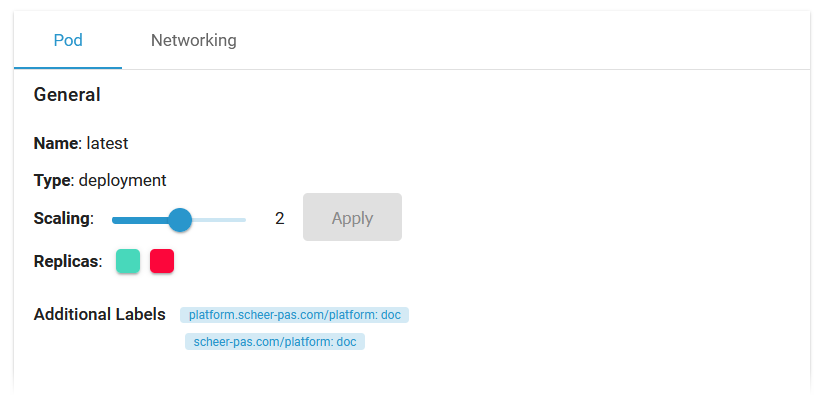
The new number of replicas is displayed after a refresh of the browser tab:
Pod - Container
Section Container consists of several tabs, one tab for each container. The content of the tabs is the same for all containers and displays the container details:
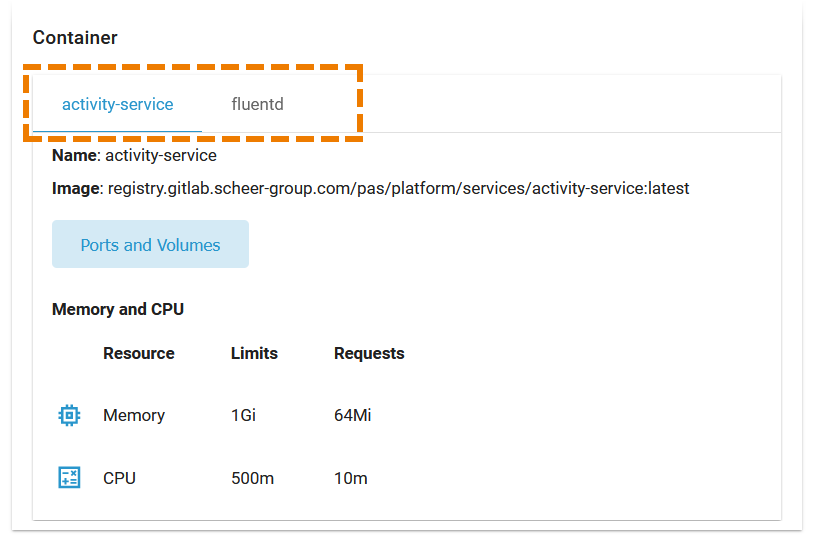
|
Name |
Name of the container. |
|---|---|
|
Image |
Image of the container. |
|
Ports and Volumes |
See below. |
|
Memory and CPU |
Shows the container limitations. If a container exceeds its memory request and the node that it runs on becomes short of memory overall, it is likely that the Pod the container belongs to will be evicted. For details see table below. Limitations cannot be changed by users. They are set during system deployment |
|
|
Limits |
Requests |
|---|---|---|
|
Memory |
If the memory limit is exceeded, the container will run in state OutOfMemory and then be killed. |
If a container exceeds its memory request and the node that it runs on becomes short of memory overall, it is likely that the Pod the container belongs to will be evicted. |
|
CPU |
If the CPU limit is exceeded, the container will be throttled, the process will slow down. |
If the CPU memory request exceeds the nodes (server) capacity, the P od can be stopped and stared on a different node. |
Expert Advice
Visit the official Kubernetes documentation for more information:
-
Resource Management for Pods and Containers for detailed information abour requests and limits.
-
Scheduling, Preemption and Eviction about the rules regarding the termination of pods.
If you click the link Ports and Volumes, the container details open in a separate pop-up:
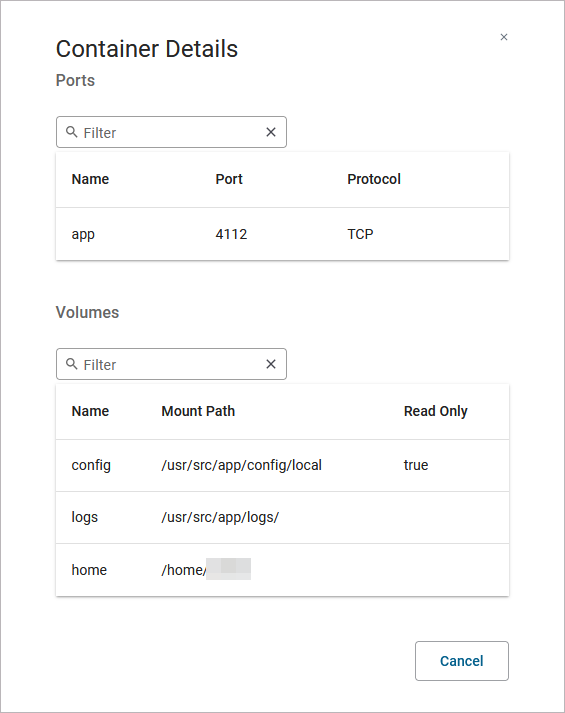
-
Ports: Displays a list of all ports exposed in the internal network.
-
Volumes: Lists all mounted volumes.
Use the filter on top of each list to search for single ports or volumes.
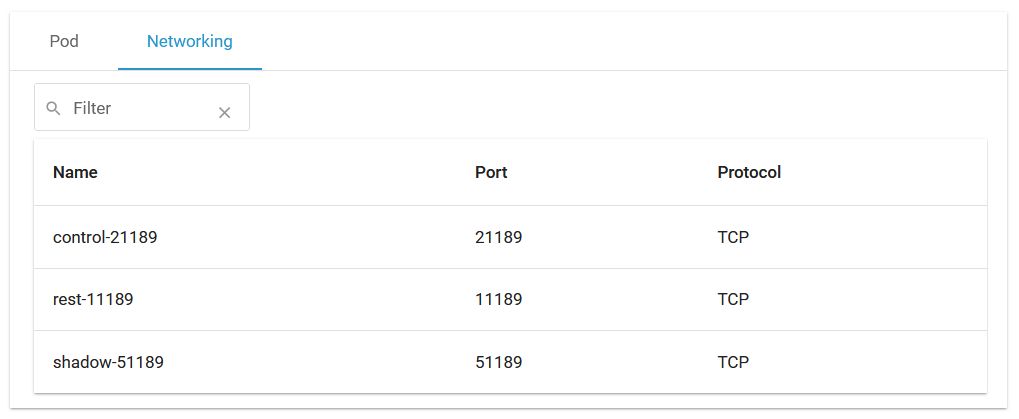
Networking
Tab Networking gives you an overview on the details of the service mesh. Use the filter to search for a port name:
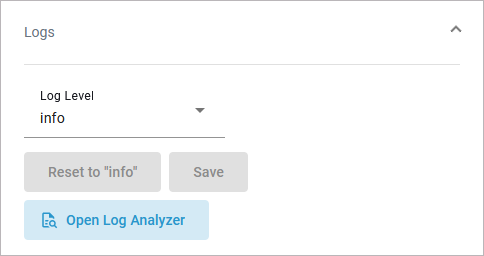
Logs
In section Logs you can change the log level. Refer to Changing the Log Level of a Workload for detailed information.
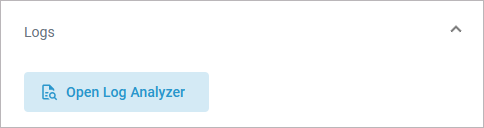
The button Open Log Analzyer gives you direct access to the log analyzer, where you can inspect the logs. Refer to Showing Workload Logs and Analyzing Logs for further information.
For some service types, the log level cannot be changed. In that case, you can still use Open Log Analzyer to inspect the logs:
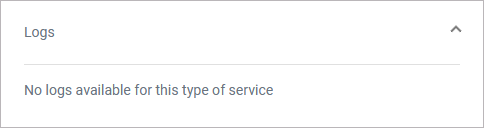
It is also possible that no logs are avilable for a service type. If this is the case, this is also indicated:
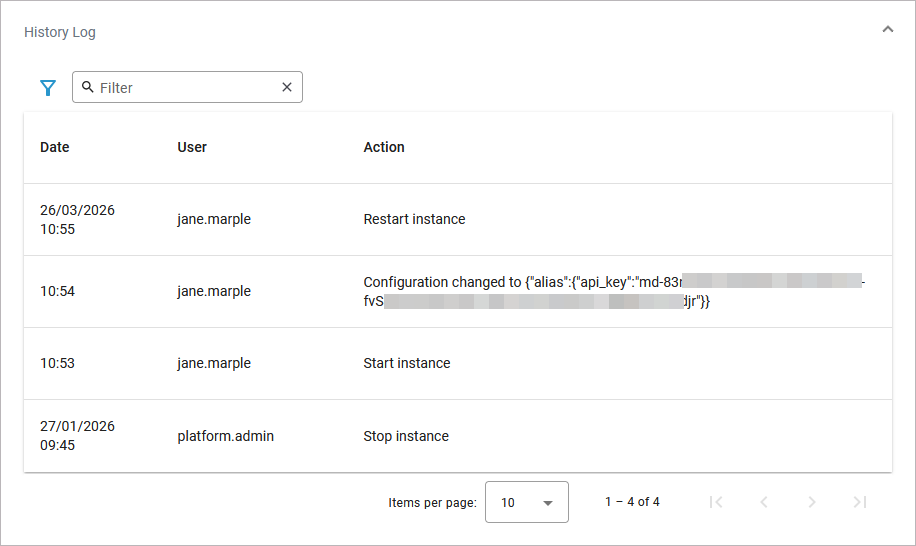
History Log
In the History Log section, that is only available for workloads of type ai-agent, you can inspect the service history. Refer to Showing Workload Logs for detailed information.
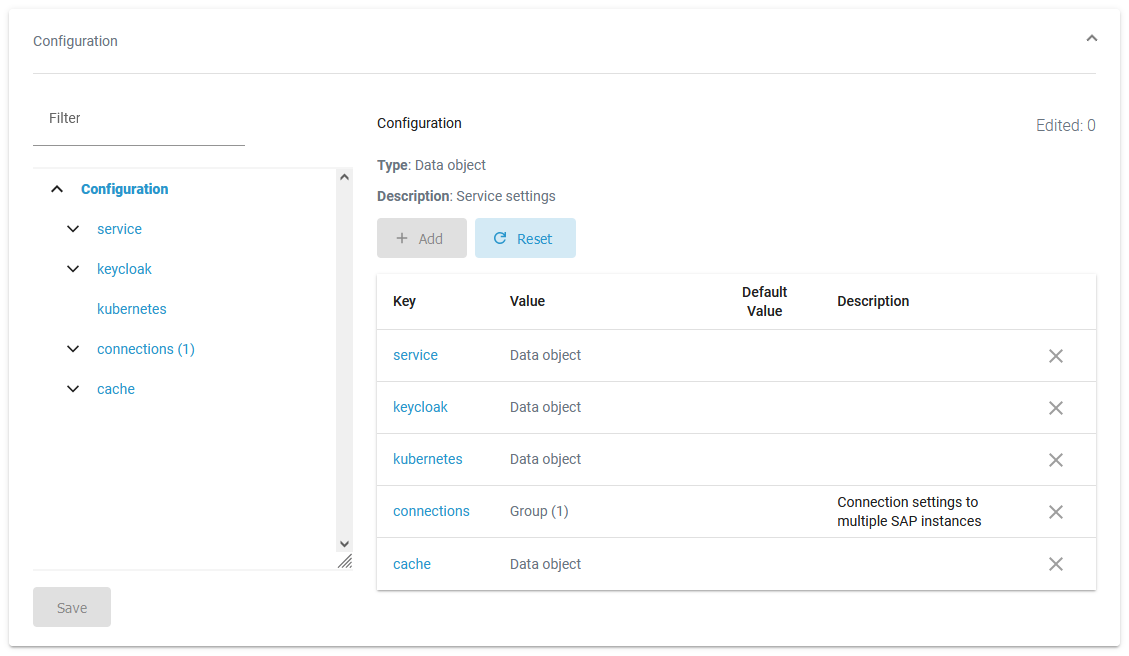
Configuration
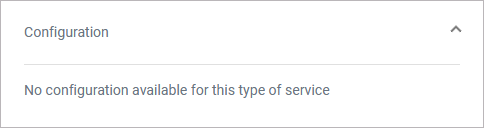
In the Kubernetes setup, it is only possible to modify configuration files in the Configuration section for the following service types:
For all other service types, no configuration settings are available:
Configuring Services of Type “ai-agent”
For an overview of all configuration settings of an ai-agent service, refer to Adapting AI Agent Workload Configuration.
Configuring Services of Type “pas-nestjs”
For services of type pas-nestjs (= internal services of the PAS platform) developers can define a service-specific schema and documentation. If a schema is available, the display in section Configuration will change and show the defined configuration options. Refer to Adapting pas-nestjs Workload Configuration for detailed information:
If no schema is available, a JSON editor is displayed in section Configuration:
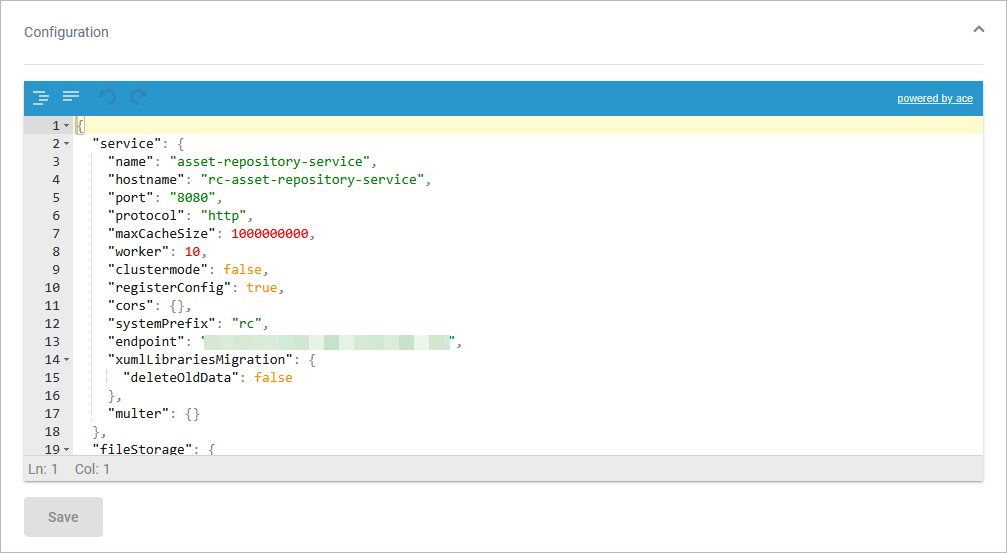
Do not edit content in the Configuration section without any knowledge of JSON.
Configuring Services of Type “xuml-service”
For an overview of all configuration settings of an xuml-service, refer to Controlling Containerized xUML Services (Kubernetes).