Collecting Logs for Process Mining in Docker Setup
Important Prerequisites
-
Only users with profile analytics_admin are able to use the Process Mining view in the User Management.
-
With PAS 22.1, the collector scheduler has been disabled by default in the analytics-collector-service.
If you want to collect data from any service you have to enable the scheduler first:
-
Open the service details in the PAS Administration.
-
Go to tab Configuration and unlock it.
-
Set variable enable to true.
"collectorScheduler": {
"enable": true,
... }
-
Please note that collecting logs is currently only supported for integration (Bridge) deployment and Kubernetes (see below).
The Services menu provides an overview of all services that deliver data.
Please note that tab Services is available on Docker setups only.
If you want to enable logging for Process Mining in a Kubernetes setup, refer to Changing the Log Level of a Containerized xUML Service (Kubernetes).
Use the list to activate/deactivate log collection for each service:
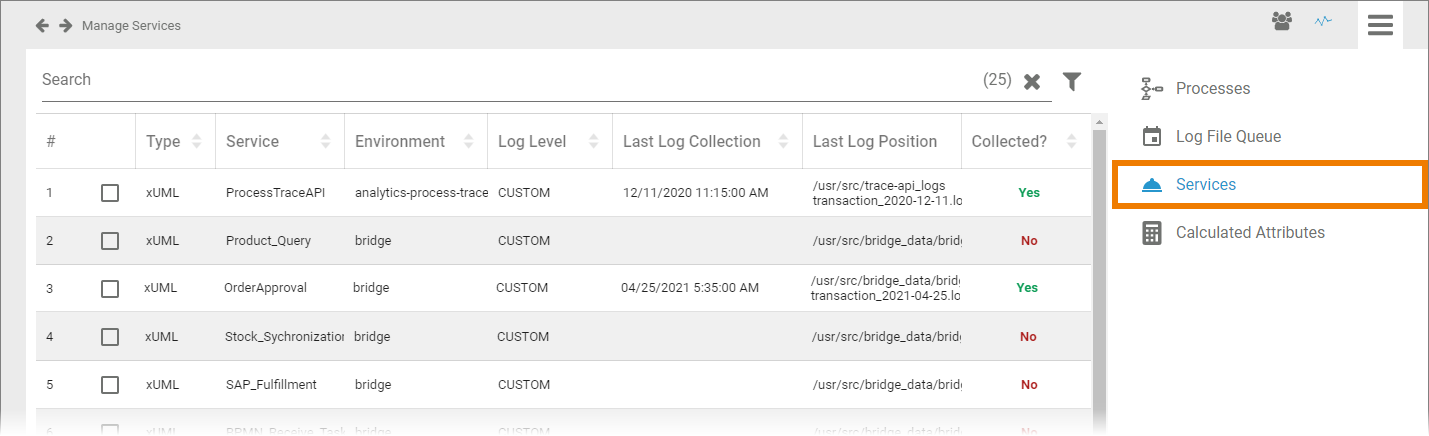
The service list contains the following information:
|
Column Name |
Description |
|---|---|

|
Number in the current services list. Select the checkbox to display the settings for the log collection. For further information see Activating Log Collection. |
|
Type |
Service type. In BPaaS and Bridge mostly xUML services are used. |
|
Service |
Name of the service that provides data. BPaaS processes are summarized in the ProcessTraceAPI service. |
|
Environment |
Source system of the service. The default environment for BPaaS data is analytics-process-trace-api. |
|
Log Level |
Log Level that was set for this service. Refer to Contents of the xUML Service Transaction Log for detailed explanations of the different log levels. |
|
Last Log Collection |
Date and time of the last log collection. |
|
Last Log Position |
Indicates up to which position (byte) in the specified file data was read during the last import. The displayed content is a combination of the name of the last read file and the last position in the file. |
|
Collected? |
Indicates if the log collection has been activated for this service (Yes) or not (No). For further information see Activating Log Collection. |
Use the Filter to limit the content of the list.
How to Collect Logs
The list of services enables administrators to monitor the used services. It also allows them to manage the collection of logs.
Activating Log Collection
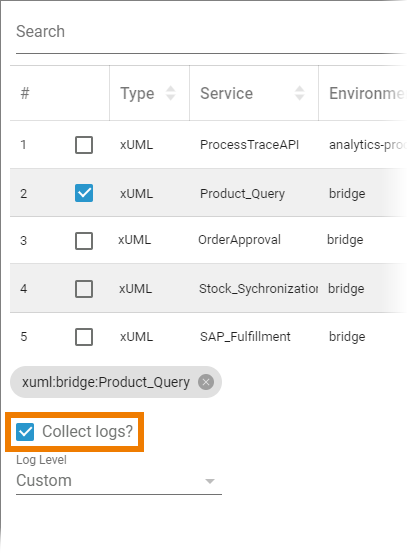
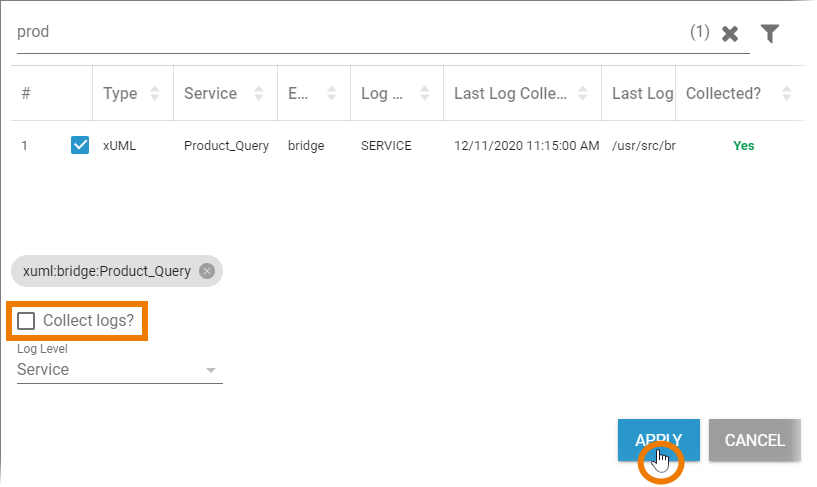
If you want to collect the logs of a service, select the checkbox in front of the service's name. The selected service is shown below the list and the option Collect logs? is displayed.
To collect the logs of the selected service, activate the checkbox Collect logs? Then choose the desired Log Level from the drop-down list. The following options are available:
-
Custom
-
Service
-
IO
Refer to Contents of the xUML Service Transaction Log for detailed explanations of the different log levels.
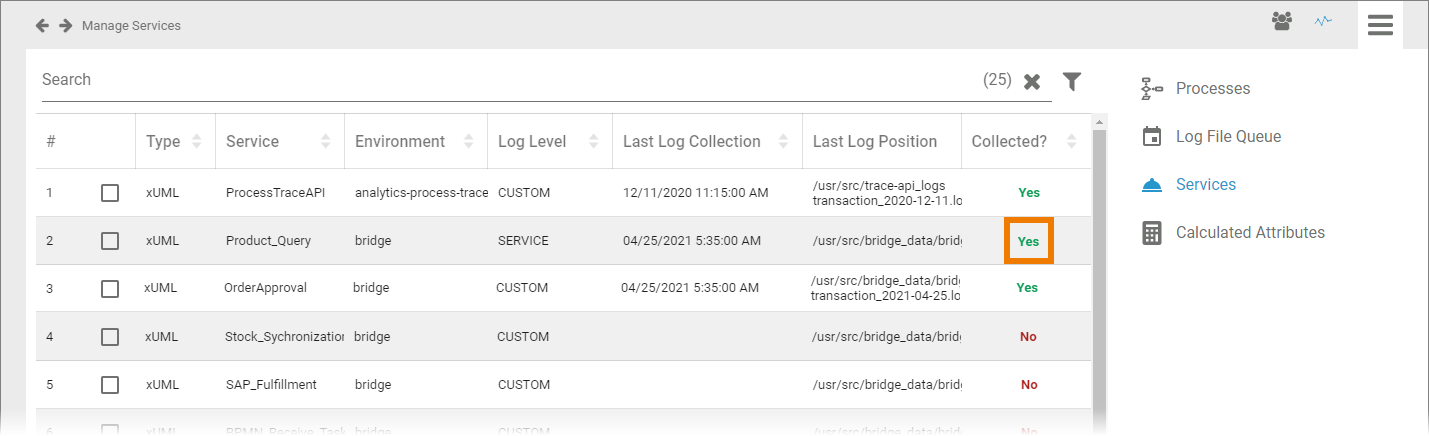
Confirm your input by pressing the Apply button. The content of column Collected? will change to Yes for this service:
Deactivating Log Collection
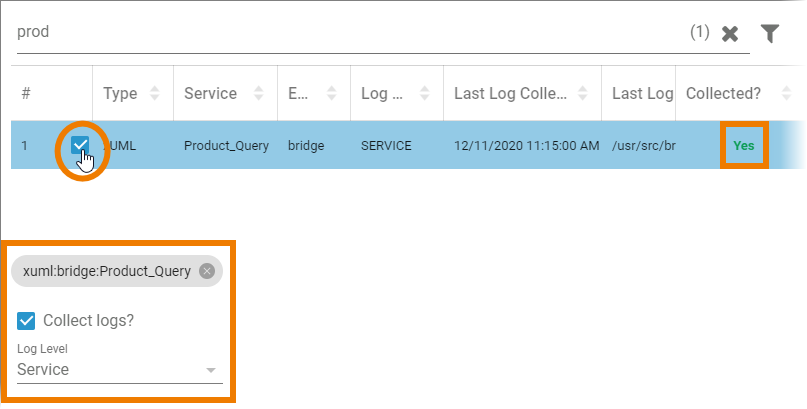
The entry in column Collected? indicates whether the service logs are collected or not. If the logs are collected, the entry is Yes. To deactivate the collection of logs for an active service, select the checkbox in front of the service's name. The selected service is shown below the list and the option Collect logs? is displayed:
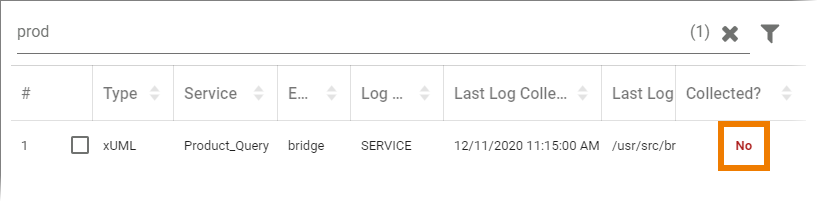
To deactivate log collection for this service, deselect the checkbox Collect logs? and confirm your choice with the Apply button:
The content of column Collected? will change to No for this service:
Collecting Logs for Process Mining in Kubernetes Setup
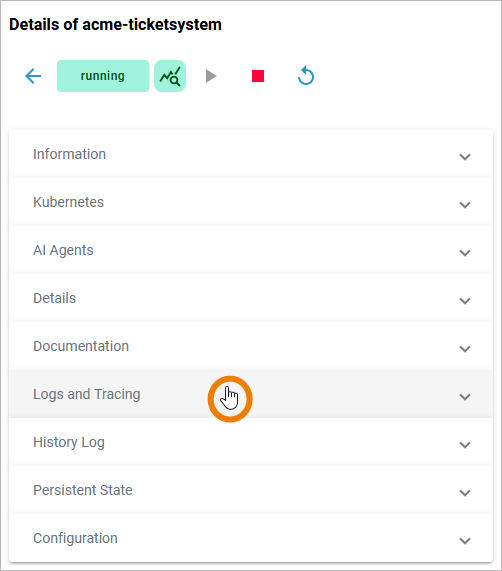
If your PAS system is running on Kubernetes, enabling the log collection is simple: Go to the PAS Administration and open the details of the service from which you want to collect the logs (refer to Changing the Log Level of a Containerized xUML Service (Kubernetes)).
Expand section Logs and Tracing:
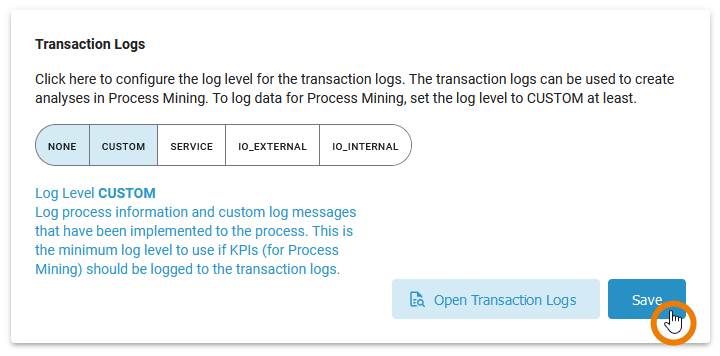
In section Transaction Logs select at least log level CUSTOM:
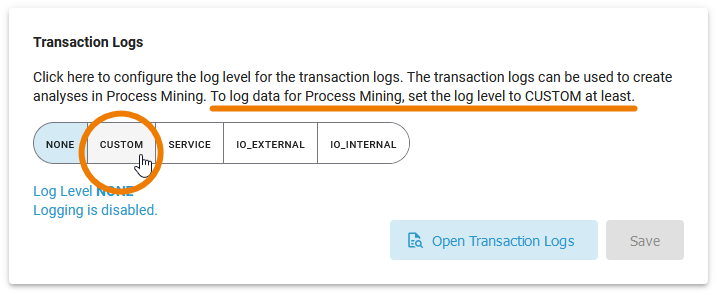
Save the new log level:
The logs are now collected, the data will be available in Process Mining.
Related Content
Related Documentation: