This option is only available for type xuml-service (= containerized xUML services).
In the administration application you have the possibility to change the log level for a containerized xUML service.
You have two options to open the input form where you can change the log level:
-
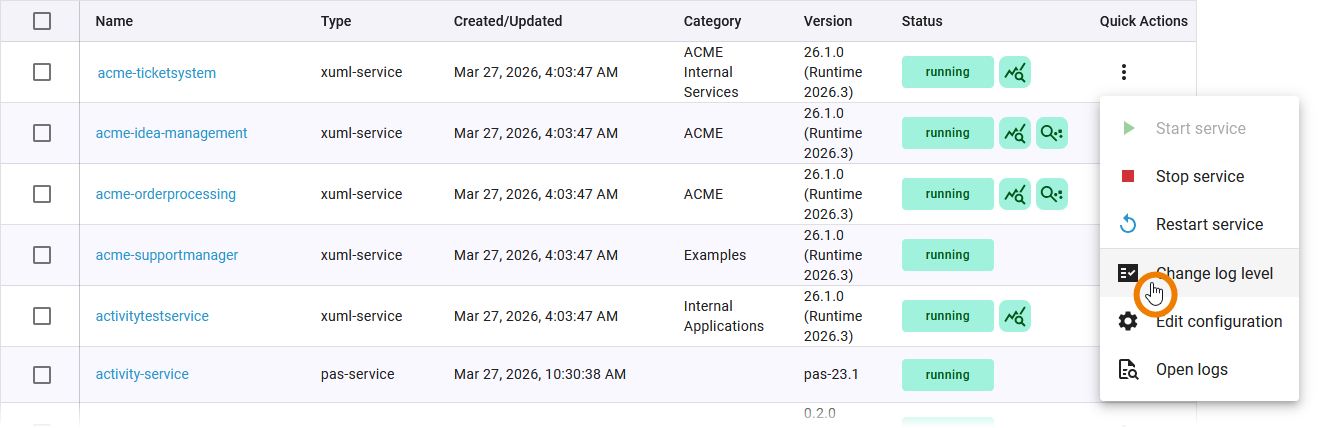
In the quick action menu of the service list, select the Change log level option. A pop-up window will then open.
-
Open the details page of the service and scroll down to section Logs and Tracing:
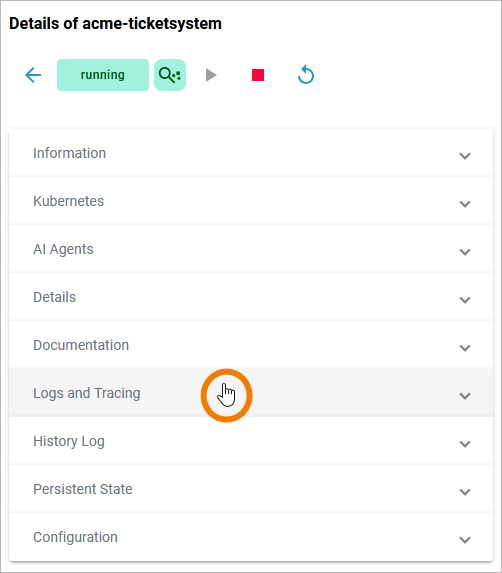
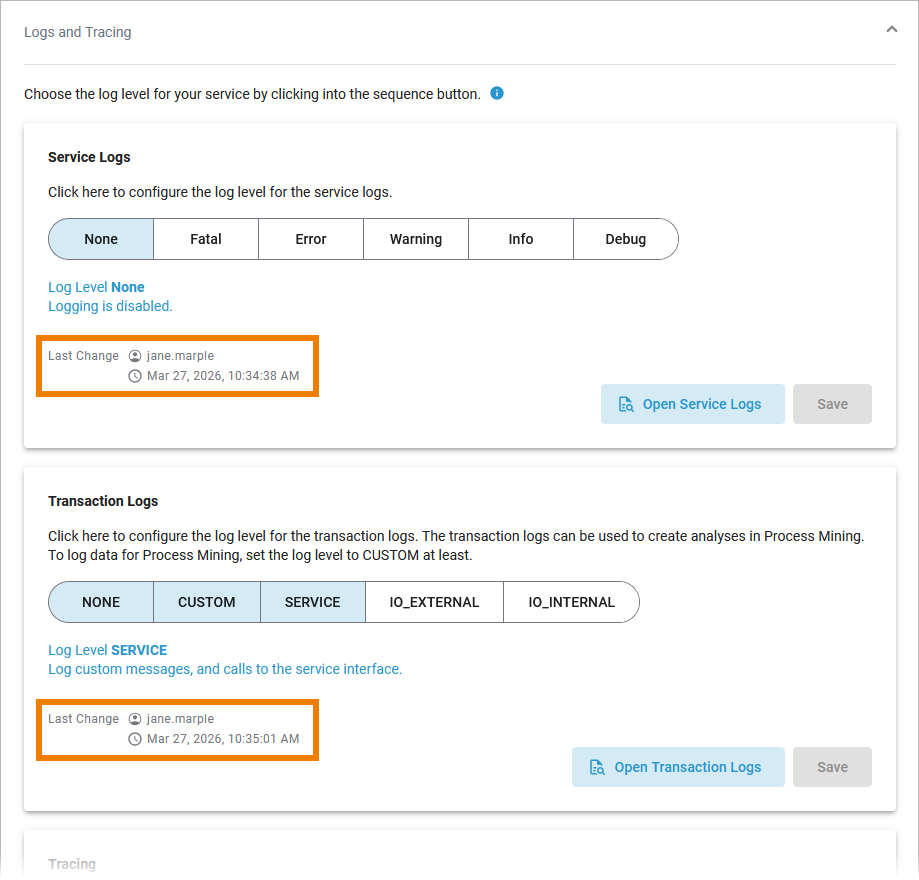
In section Logs and Tracing you have the choice between:
-
Service Logs
-
Transaction Logs
-
Tracing (refer to Disable Tracing for a Containerized xUML Service (Kubernetes) for details about this option)
In addition to the log level settings, you also get some additional information:
|
Service Logs |
|
|---|---|
|
Transaction Logs |
|
Default Retention Time of Log Files
The following retention times are valid for log files of your PAS installation:
-
Container logs: Log files inside all containers are deleted after 7 days.
-
Log Analyzer (OpenSearch) logs:
-
Single cluster: Log files are deleted after 14 days.
-
High Availability cluster: Log files are deleted after 30 days.
-
-
Integration (Bridge) logs: The default retention time for Bridge logs is 30 days. This is configurable in the UI, refer to Node Instance Preferences.
Changing the Service Logs
You can set the following log levels for each xUML service. The higher the log level, the more information is written to the log files. The log levels in the table below are cumulative and are ordered from the lowest to the highest log level. For each log level, also the information of the lower levels is logged.
|
Log Level |
Description |
|
|---|---|---|
|
None |
Logging is disabled. |
|
|
Fatal |
Logs fatal errors. |
A fatal error means that the service cannot continue its normal execution, e.g. due to repository errors, system limitations like no more available threads or memory. These errors need the intervention of an administrator to solve the problem. |
|
Error |
Logs fatal errors and other errors. |
Errors other than fatal errors are not written if they are caught in the Designer service model, e.g. connection errors, wrong SQL statements, applying operations to invalid values, and so forth. If an error is caught, the modeler must take care of the error handling. |
|
Warning |
Logs errors and warnings. |
Warnings indicate unexpected but non-critical situations that do not interrupt normal operation. |
|
Info |
Logs errors, warnings, and general information about your process steps and other service events. |
This general information includes, for instance, which component is being started or stopped, loaded add-ons, licensing information, etc. |
|
Debug |
Logs errors, warnings, general information, and low-level debug information.
|
In addition to log level Info, low-level debug information is written into an error file specified in the error message. Furthermore, the full adapter communication stream is written to the xUML service standard log.
Use this log level with care and only when investigating problems. As all tracing information has to be logged, it may result in significant loss of performance with increasing complexity of the deployed xUML service. |
If an error occurred, a call stack is written into the error log exposing the path to the action state where the error occurred in the model.
[2006-04-20 08:31:13 W. Europe Standard Time][Error] [Internal][FUASM][3][Division by zero - Callstack: calculate > Calculation > call_Division > Division > Divide]
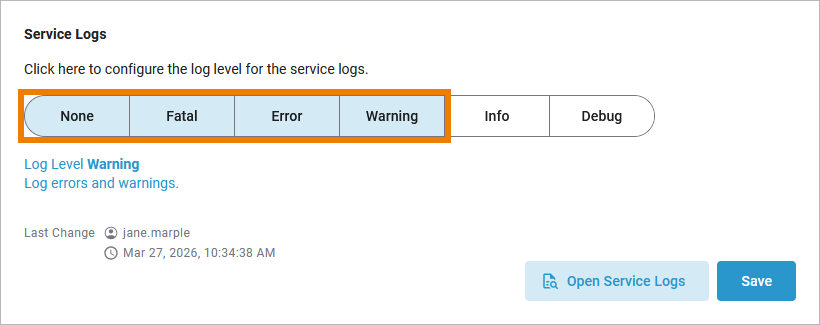
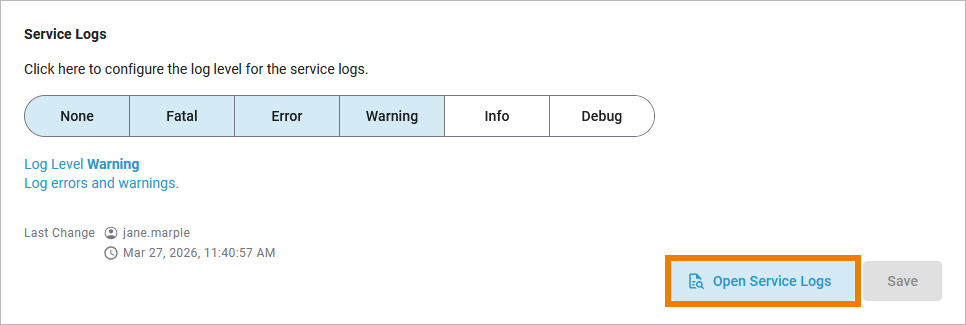
In the sequence button, click the log level you want to apply. In our example, Warning is selected:
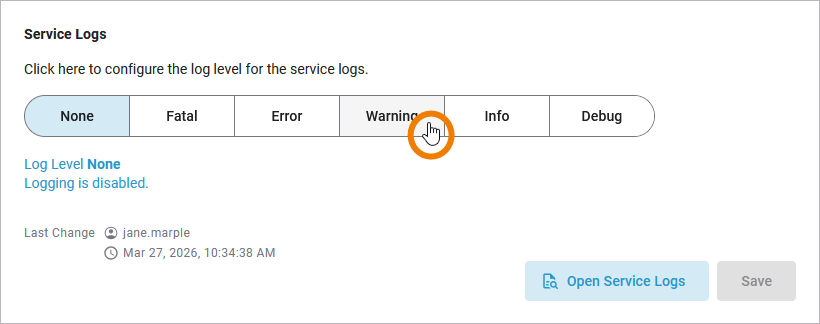
Since the log levels are cumulative, selecting Warning also includes the log levels Fatal and Error:
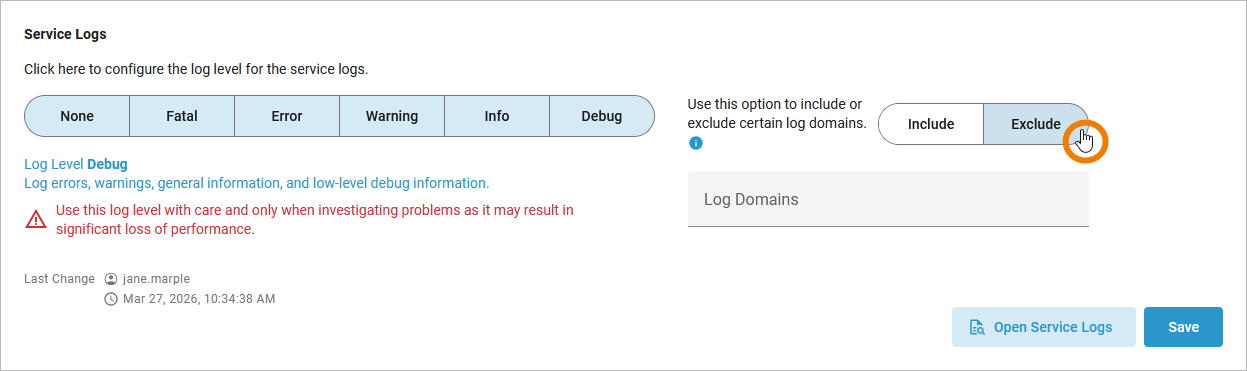
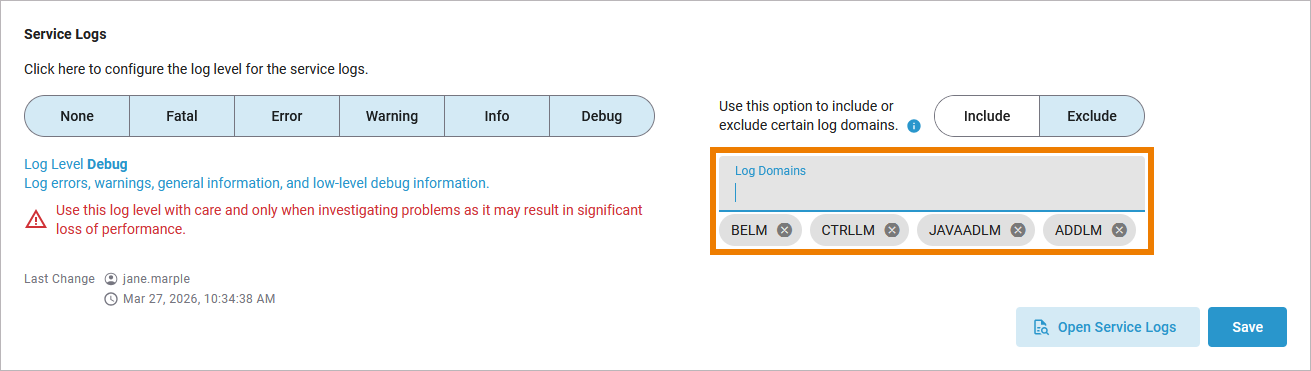
If you select the highest log level Debug, you have an additional option: You can include or exclude specific log domains (refer to Log Errors in the Designer Guide for an overview on all error domains). First select if you want to Include or Exclude the log domains:
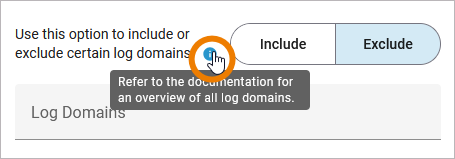
Click on the information icon to open the documentation chapter in which all error codes are listed and explained:
Now click inside field Log Domains to choose the domains you want to include/exclude from a drop-down list:
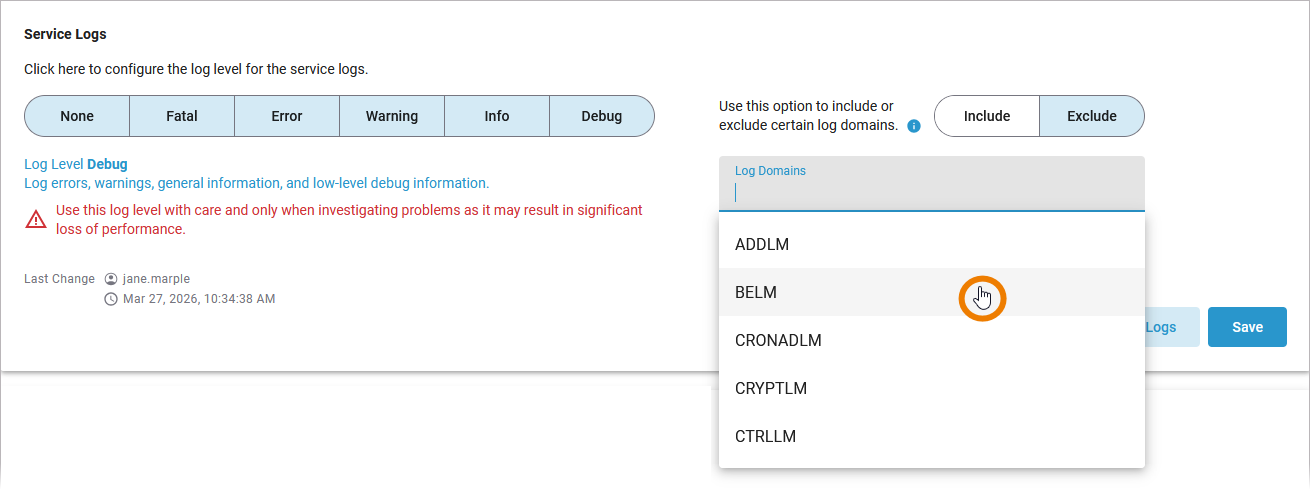
Multiple selection is possible, just reopen the list of domains and select another domain. All selected domains are displayed below the Log Domains field:
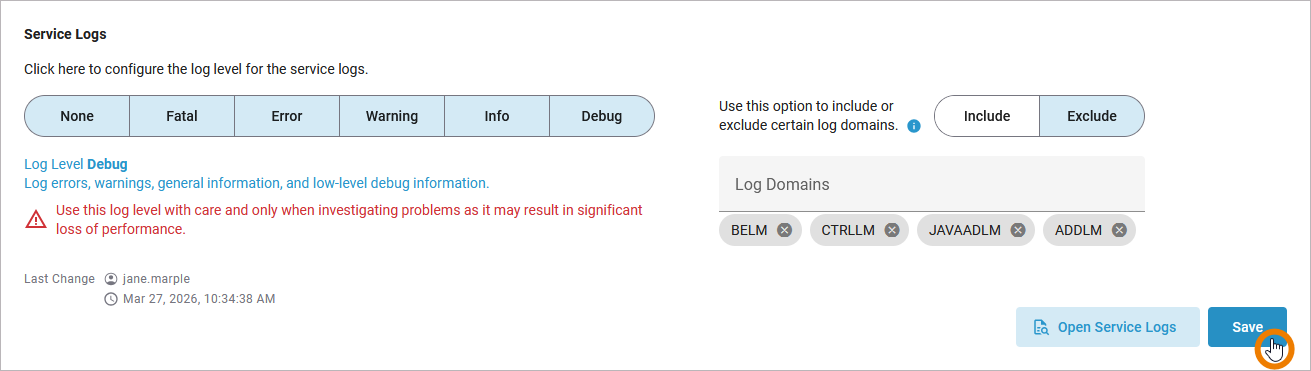
Use log level Debug with care and decrease the log level when you finished debugging, because log level Debug may result in a significant loss of performance!
When you are done, Save your changes:
Click Open Service Logs to inspect the service logs directly in the Log Analyzer, refer to Showing Logs of a Containerized xUML Service (Kubernetes) for further information:
For more information about the Log Analyzer, refer to Analyzing Platform Logs.
Changing the Transaction Logs
You can set the following transaction log levels for each xUML service. The higher the log level, the more information is written to the log files. The log levels in the table below are cumulative and are ordered from the lowest to the highest log level. For each log level, also the information of the lower levels is logged.
|
Log Level |
Description |
|
|---|---|---|
|
None |
Logging is disabled. |
|
|
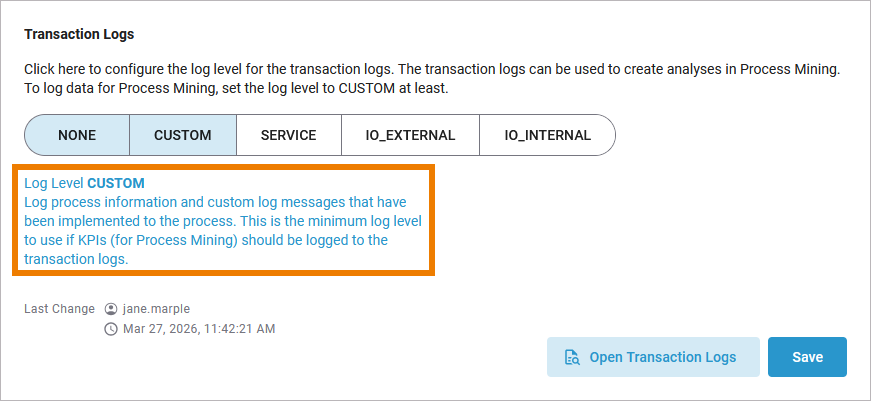
Custom |
Logs process information and custom log messages that have been implemented to the process. This is the minimum log level to use if KPIs (for Process Mining) should be logged to the process logs. |
For more details, refer to Logger Adapter Reference in the Designer Guide. |
|
Service |
Logs custom messages, and calls to the service interface. |
Logs, for example, start and end of calls to REST, SOAP, SAPRFC, or HTTP operations. |
|
IOExternal |
Logs custom messages, calls to the service interface, and adapter calls to external systems. |
External systems, for example, are SAP, SQL, REST, etc. For SQL access, for instance, the queries sent to the database will be logged as well. Calls via the file system and system adapter are excluded. |
|
IOInternal |
Logs custom messages, calls to the service interface, and adapter calls to external and internal systems. |
Logs also calls to internal systems like , e.g., the Filesystem Adapter. |
Logging also includes start and end time of service calls and can be used to analyze process performance. Refer to Contents of the xUML Service Transaction Log in the Administration Guide for a reference page with all transaction log details.
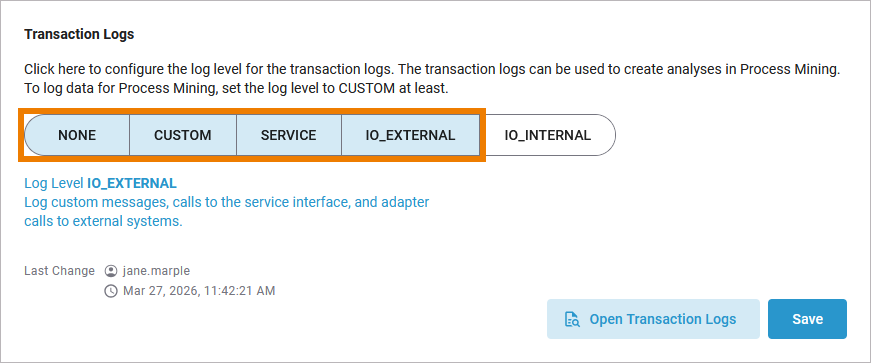
In the sequence button, click the log level you want to apply. In our example, IO_EXTERNAL is selected:
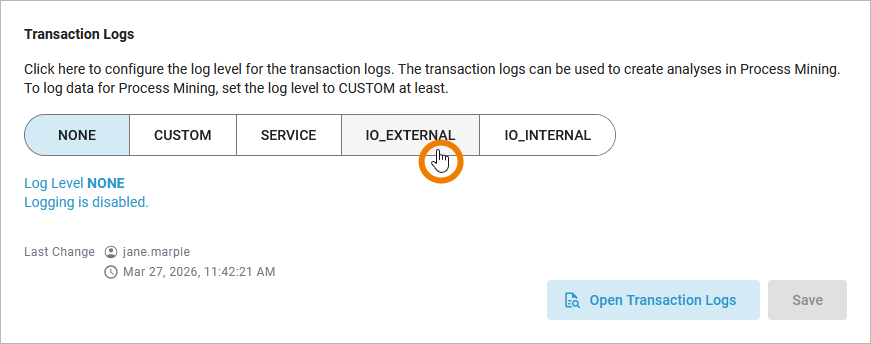
Since the log levels are cumulative, selecting IO_EXTERNAL also includes the log levels CUSTOM and SERVICE:
If you want to log data for usage in Process Mining, you must at least select log level CUSTOM:
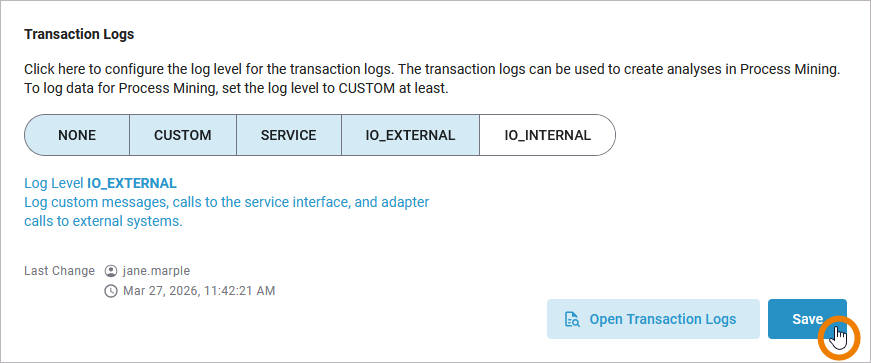
When you are done, Save your changes:
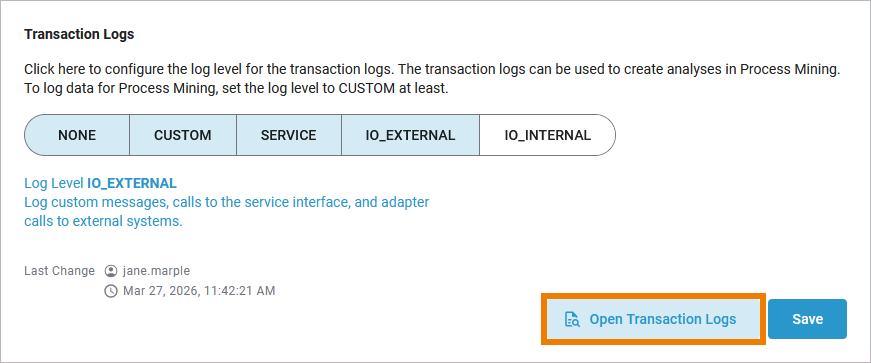
Click Open Transaction Logs to inspect the transaction logs directly in the Log Analyzer, refer to Showing Logs of a Containerized xUML Service (Kubernetes) and Analyzing Logs for further information:
Related Content
Related Documentation: