In the administration application you have the possibility to change the log level for a Docker container. The functionality is currently available for the following service types:
-
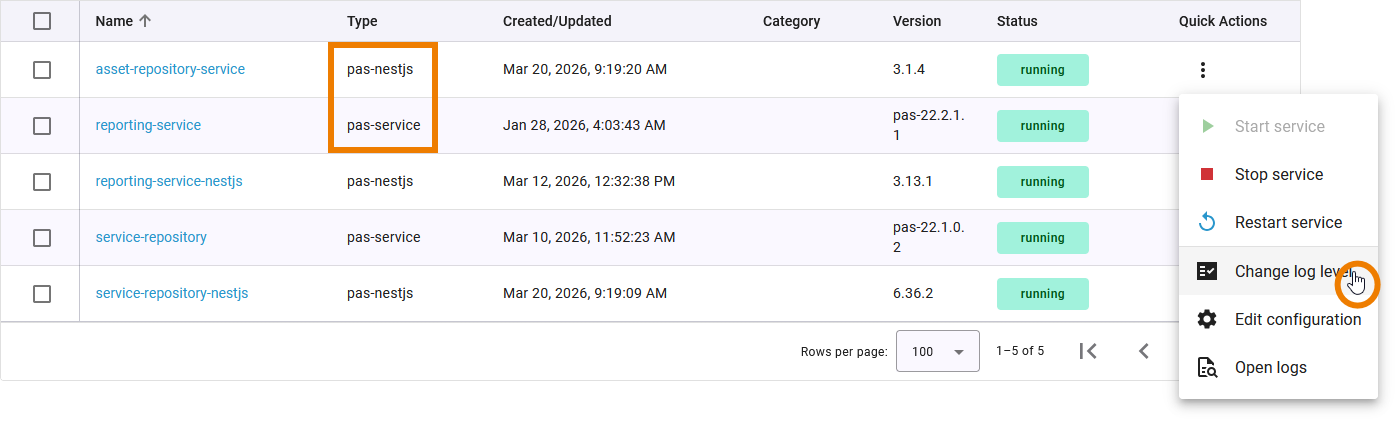
pas-nestjs = PAS services based on NestJS
-
pas-service = PAS applications without UI
You have two options to open the input form where you can change the log level:
-
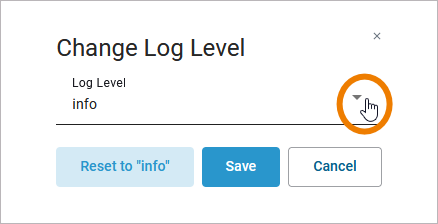
In the quick action menu of the service list, select the Change log level option. A pop-up window will then open.
-
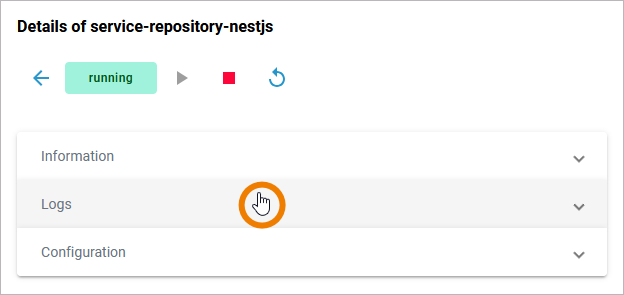
Open the details page of the service and scroll down to section Logs:
Changing the log level varies for the different service types. The details are explained below.
Default Retention Time of Log Files
The following retention times are valid for log files of your PAS installation:
-
Container logs: Log files inside all containers are deleted after 7 days.
-
Log Analyzer (OpenSearch) logs:
-
Single cluster: Log files are deleted after 14 days.
-
High Availability cluster: Log files are deleted after 30 days.
-
-
Integration (Bridge) logs: The default retention time for Bridge logs is 30 days. This is configurable in the UI, refer to Node Instance Preferences.
Log Level for Service Type pas-nestjs
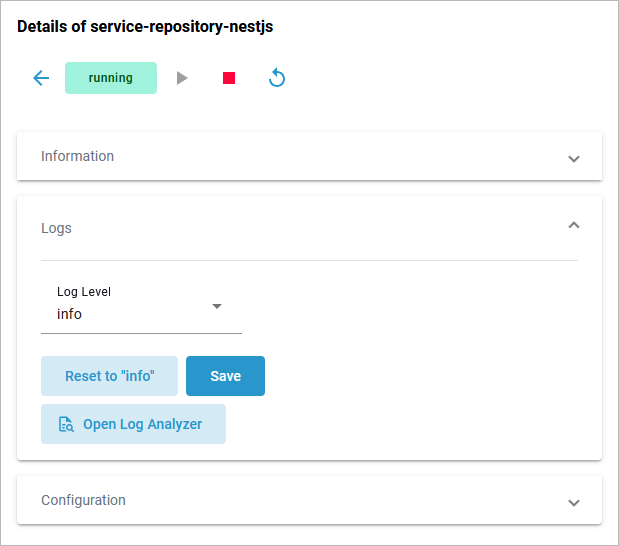
On the details page of a pas-nestjs service, scroll down to section Logs and expand the section:
If you open the pop-up window via the quick actions, you have the same options for the Configuration of the logs:
Available log levels are:
-
verbose
-
trace
-
debug
-
info
-
warn
-
error
If you have turned down the log level to see more logs, do not forget to turn it up again after you have finished your analysis. The performance of the system may deteriorate if a lot of logs are stored for a long time. The log level settings are reset to its default value during a restart of the service.
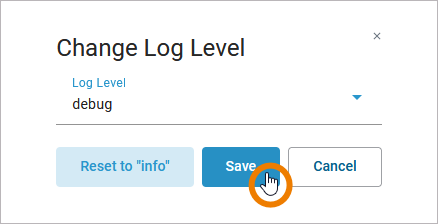
Save your changes to apply them to the service. Use Reset to “info” to return to the info log level. If you opened the pop-up window from the quick action menu in the service list, you have also a Cancel button. Click Cancel to discard your changes and to close the pop-up window:
In the Logs section of the service details page, you can also use option Open Log Analyzer:
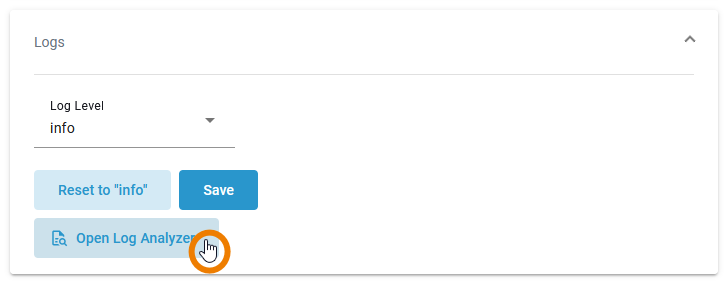
The Log Analyzer opens and displays the relevant logs:
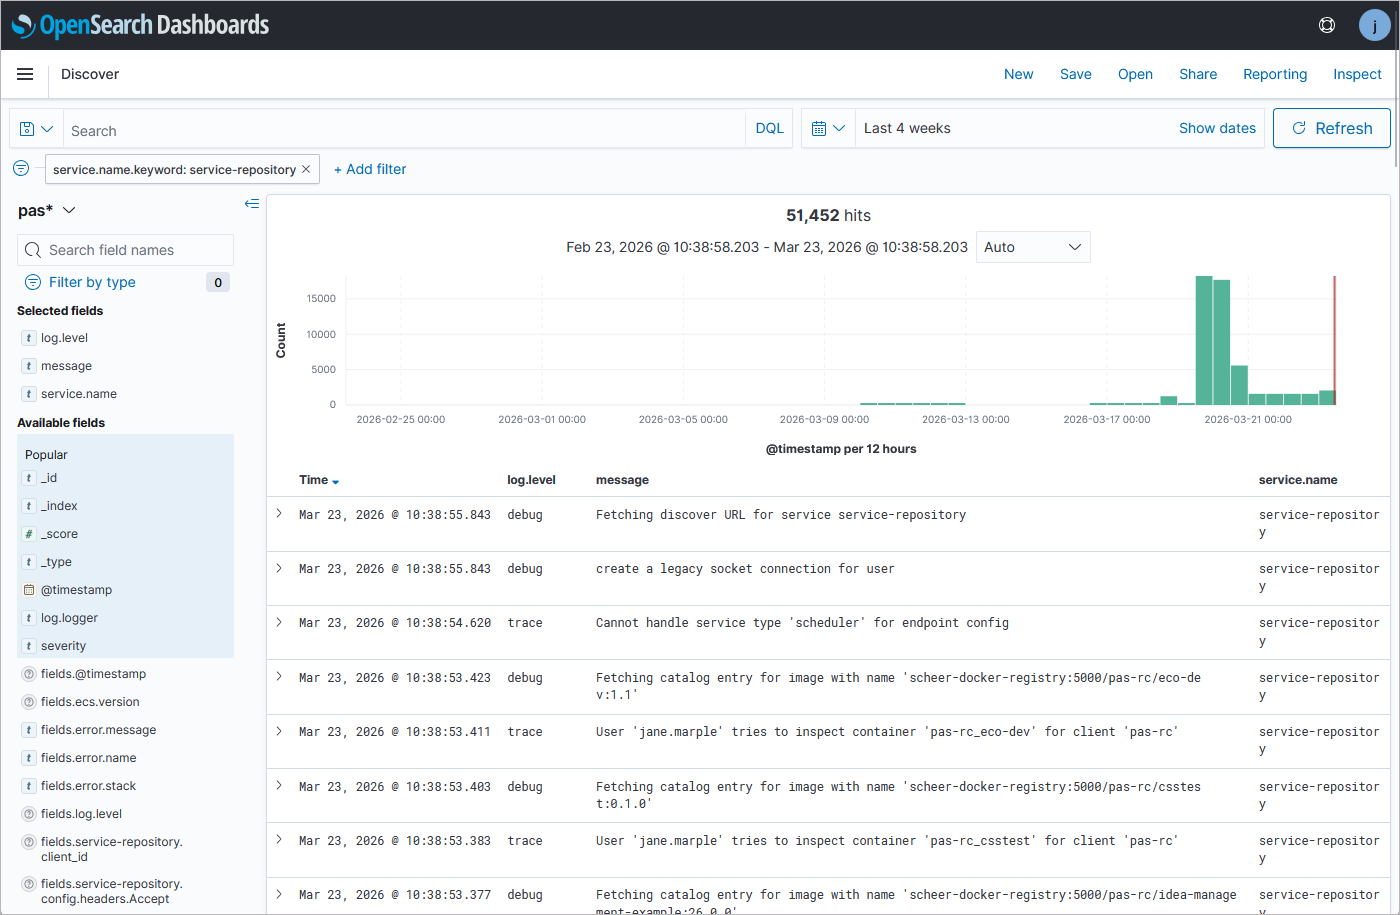
For more information about the Log Analyzer, refer to Analyzing Platform Logs.
Log Level for Service Type pas-service
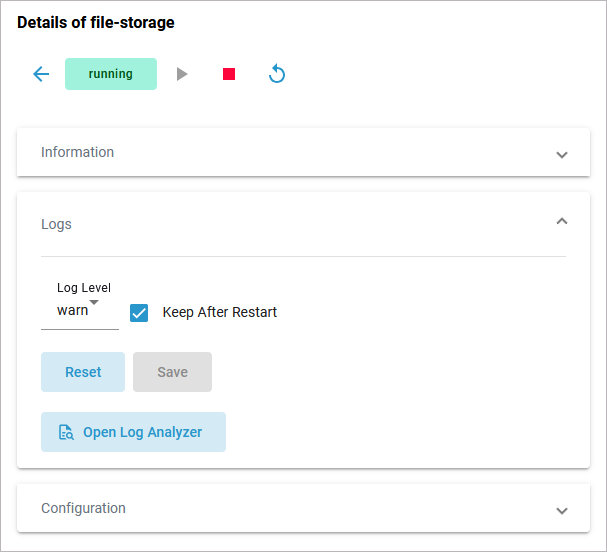
On the details page of a pas-service, scroll down to section Logs and expand the section:
If you open the pop-up window via the quick actions menu, you have the same options to change the log level:
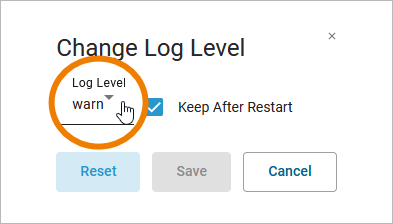
Open the drop-down list to select one of the available log levels:
-
trace
-
debug
-
info
-
warn
-
error
-
fatal
If you have turned down the log level to see more logs, do not forget to turn it up again after you have finished your analysis. The performance of the system may deteriorate if a lot of logs are stored for a long time. The log level settings are reset to its default value during a restart of the service.
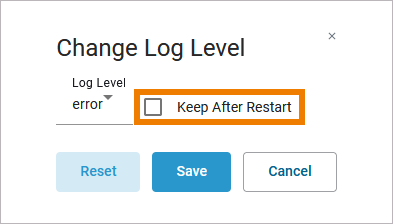
The chosen log level is kept after a restart of the service. If after a restart of the service you want to return to the previously used log level, disable option Keep After Restart:
Save your changes to apply them to the service. Click the Reset button to return to the default settings. If you opened the pop-up window by useing the icon in the service list, you have also a Cancel button. Click Cancel to to discard your changes and to close the pop-up window.
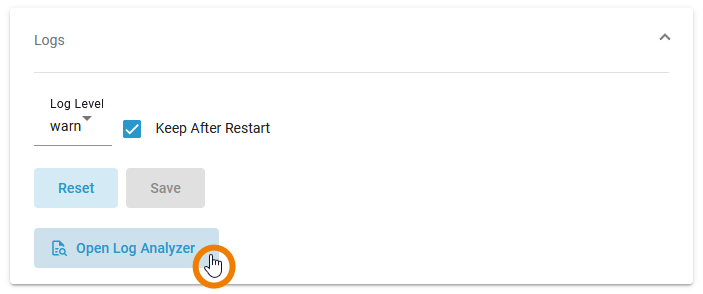
In the Logs section of the service details page, you can also use option Open Log Analyzer:
The Log Analyzer will open, showing you the corresponding logs:
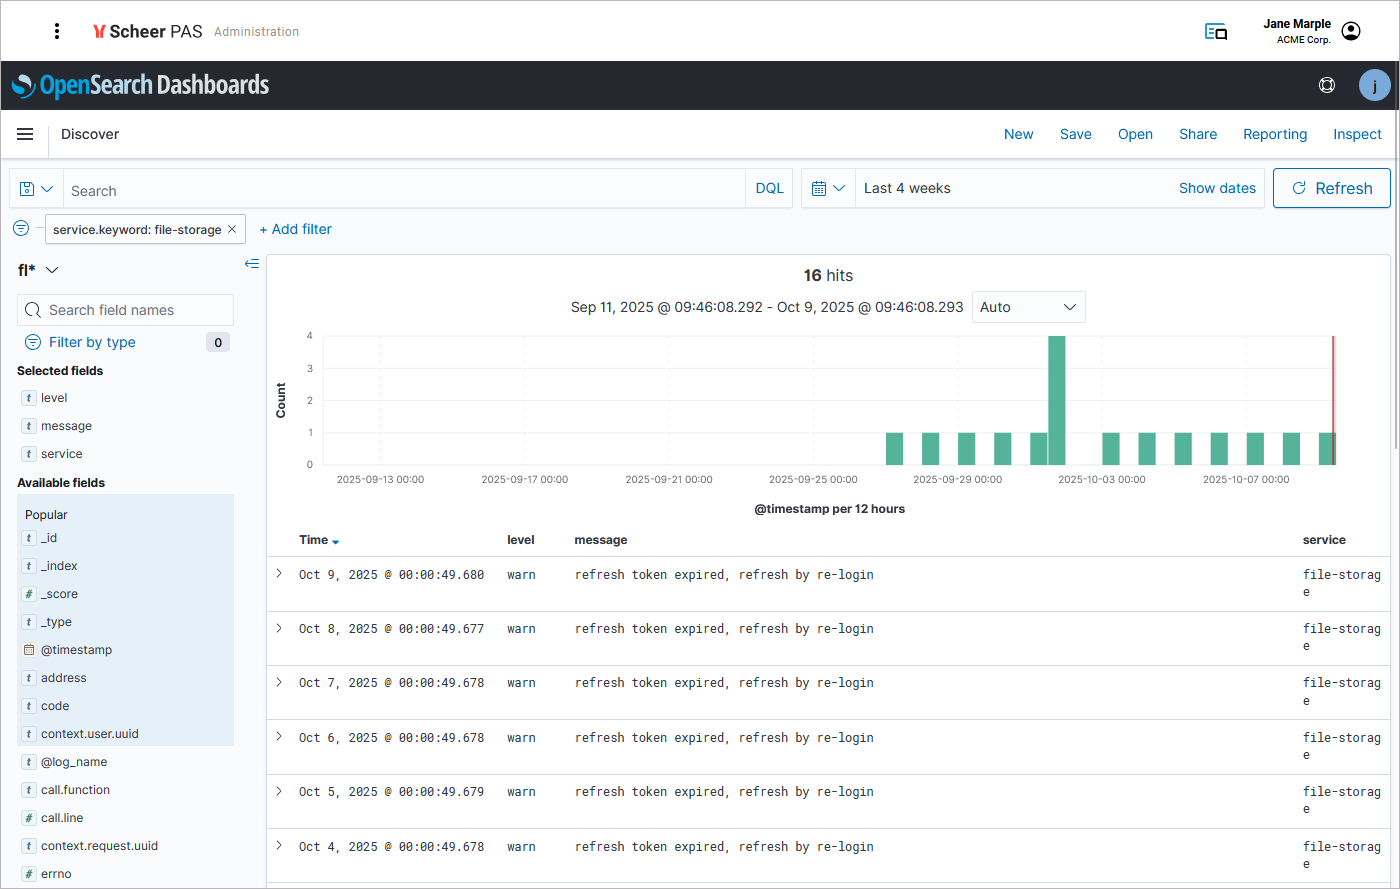
For more information about the Log Analyzer, refer to Analyzing Platform Logs.