If pausing on a breakpoint switch to the Callstack tab of the E2E Interactive Debugger.
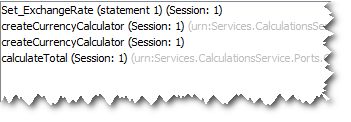
Figure: The Callstack Tab of the E2E Interactive Debugger
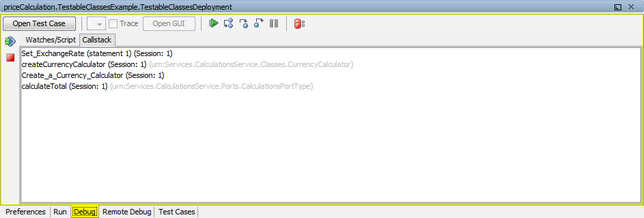
The Callstack tab provides information on the call hierarchy of the executed service.
|
|
The callstack is to be read bottom up: the latest call is on top. In the screenshot on the right, the following information can be extracted:
-
calculateTotal (name of the SOAP operation) represents the first UML element being executed.
-
Create a Currency Calculator (name of the action node) in calculateTotal from which the execution branches.
-
Execution branched to createCurrencyCalculator (name of the class operation), which was called as a call operation action.
-
The actual element being executed is the action script of action node Set ExchangeRate. The Interactive Debugger paused on statement 1, which will be executed next.
|