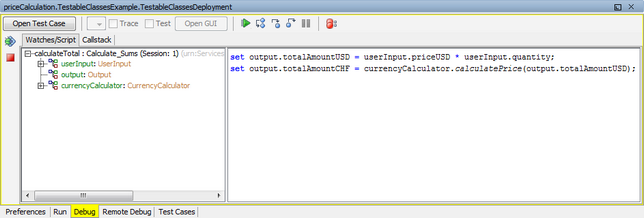
When the E2E xUML Runtime stopped service execution on a breakpoint the action script and runtime values of the corresponding action node are displayed in the Debug tab and can be inspected.
Figure: Interactive Debugger pausing on a Breakpoint
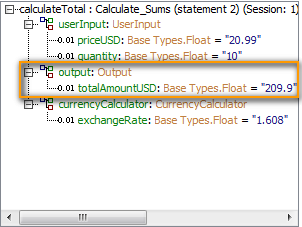
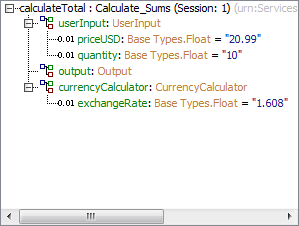
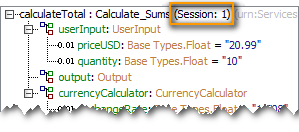
The runtime values are displayed in he left panel of the Debug tab.
|
|
Expand the tree to look at the attribute values. |
|
|
The label Session: 1 indicates that this is the first run of the test case within this service run. |

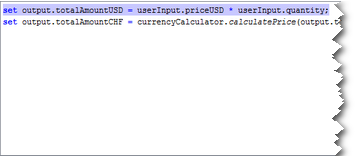
The action script is displayed in the right panel of the Debug tab.
|
|
Click |
|
|
Step through the action script by clicking |