Portainer: Administrating Services
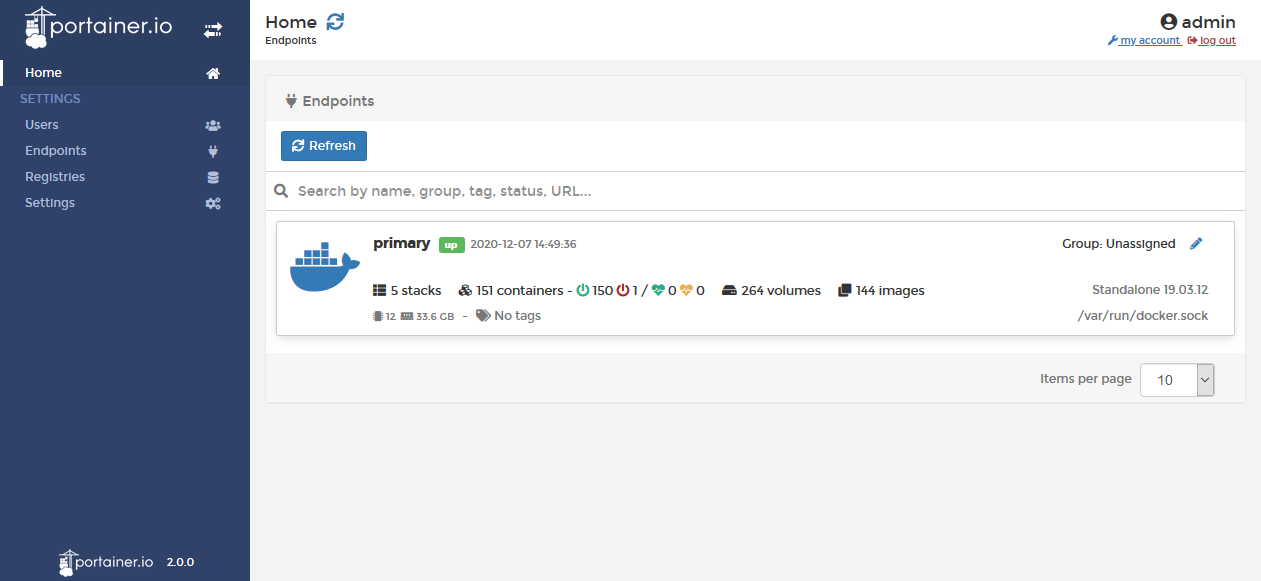
Scheer PAS uses Portainer to manage the platform components. Portainer is used since PAS 20.1. In earlier versions, administrators must use the Bridge for this purpose.
Portainer is only available for on-Premises installations of Scheer PAS.
Portainer is an open source toolset that allows you to build and manage containers in Docker. For this purpose, Portainer provides an easy to use GUI that PAS customers can use to administer the platform components.
In the Official Portainer Documentation you will find detailed descriptions of all Portainer functionalities. Please note that the official documentation may vary according to different versions of the tool.
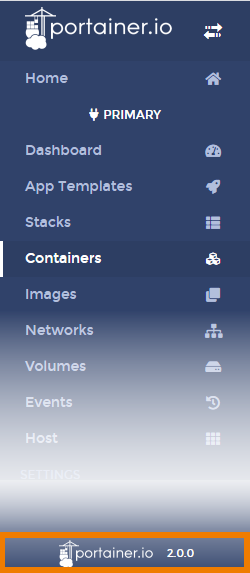
Before consulting the documentation check your Portainer version. It is displayed at the bottom of the Portainer sidebar.
Functionalities of Portainer
Administrators of the Scheer PAS platform can use Portainer to do the following:
Starting and Stopping Services
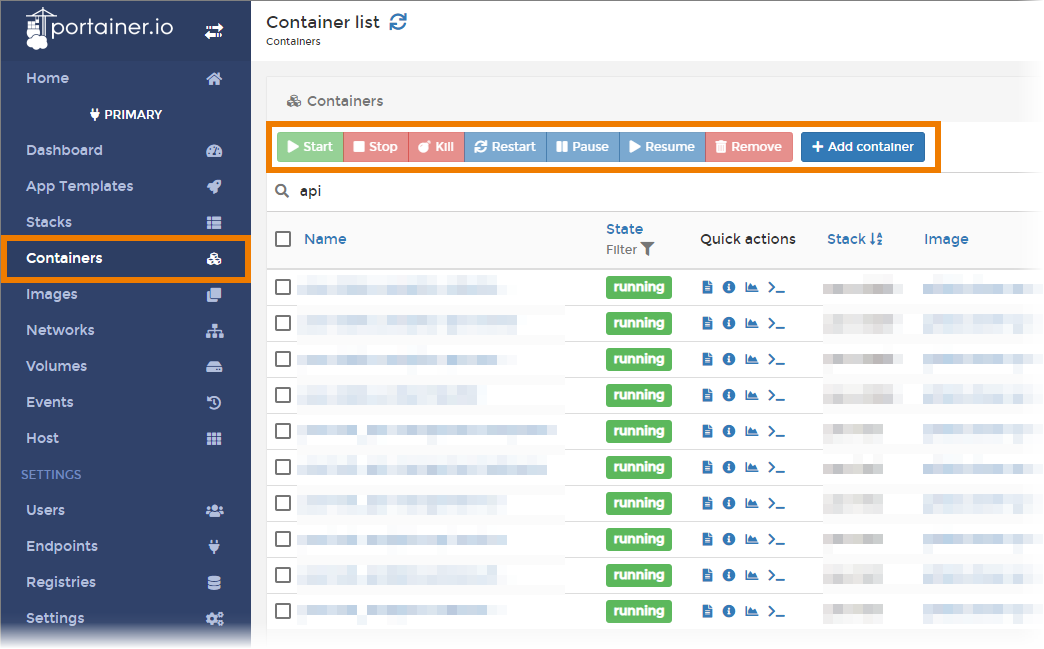
Portainer gives you the possibility to manage the services, for example to start and stop them.
Open the container list and use the Portainer toolbar...
-
...to start,
-
...to stop,
-
...to kill,
-
...to restart,
-
...to pause,
-
...to resume,
-
...to remove and
-
to add containers.
View Container Logs
Portainer also gives you insight in the containers and the container logs. There are two ways to open the container logs:
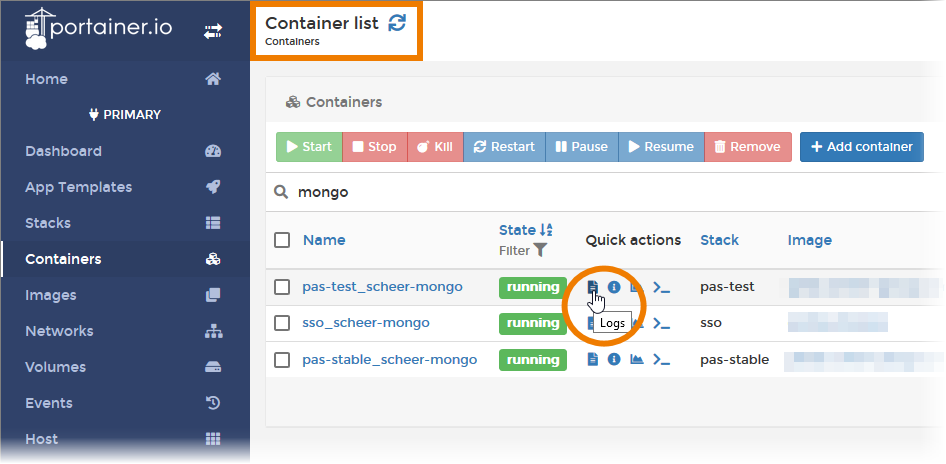
Click on the Logs icon in the container list:
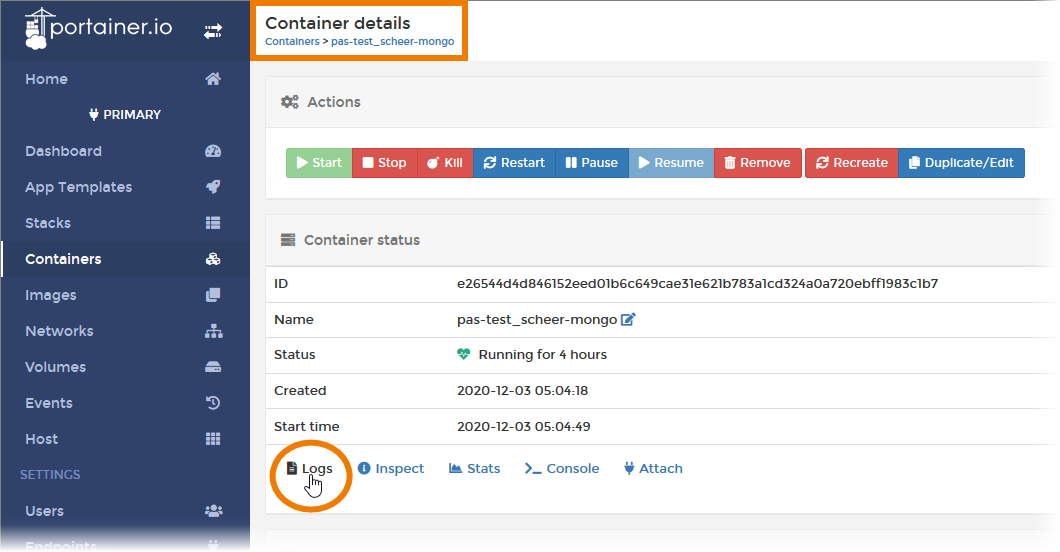
Open the container details and select option Logs:
The filter logs page contains two sections:
-
Log viewer settings: Use the displayed options to filter and search the logs. Some options also allow you to customize the display of the logs.
-
Log window: In the lower window, the log entries are displayed.

For detailed information see Inspect a Container in the Official Portainer Documentation.
Access Logs of Platform Services
Portainer allows you to get access to the logs of the platform services, but we recommend to use Kibana to do this. The default log level is warn (only warn and error are taken into account).
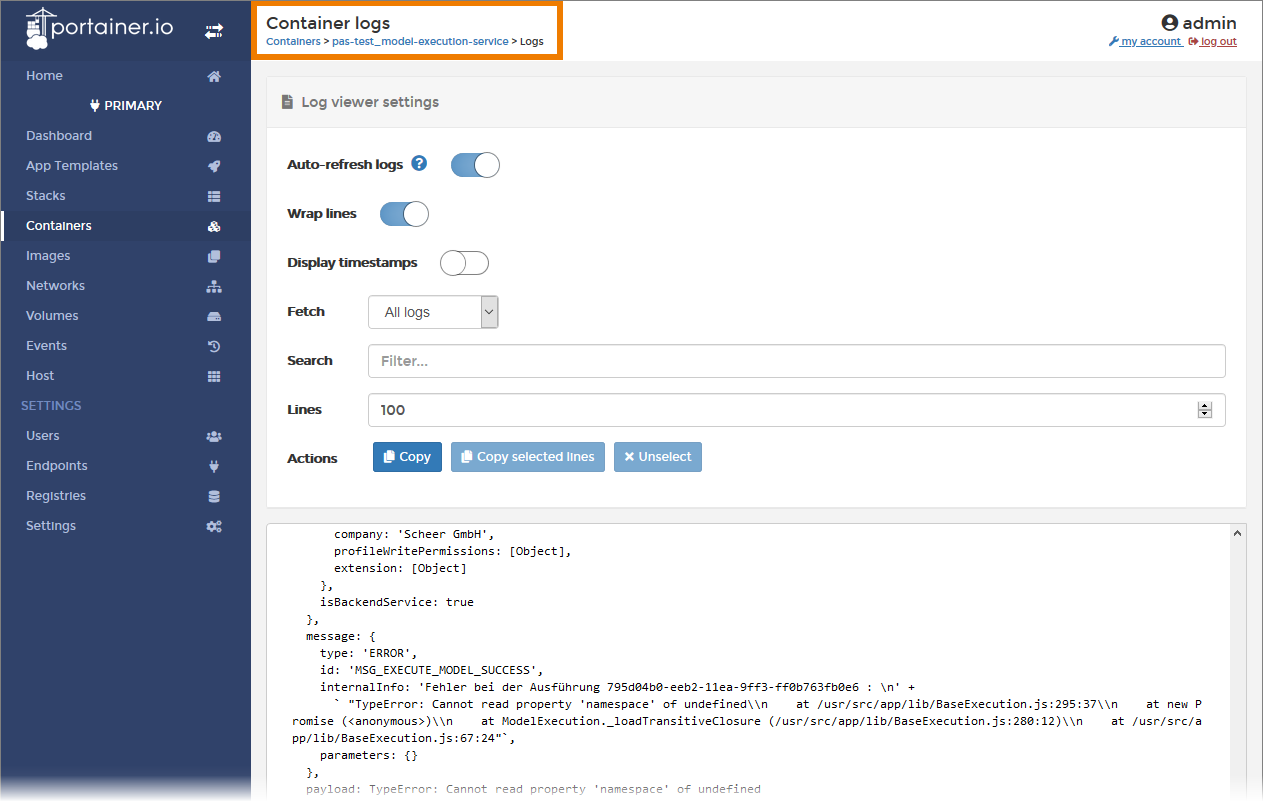
For detailed information see View Container Logs in the Official Portainer Documentation.
If you need to change the log level, see section How to Change the Log Level for a detailed description.
Change Configuration
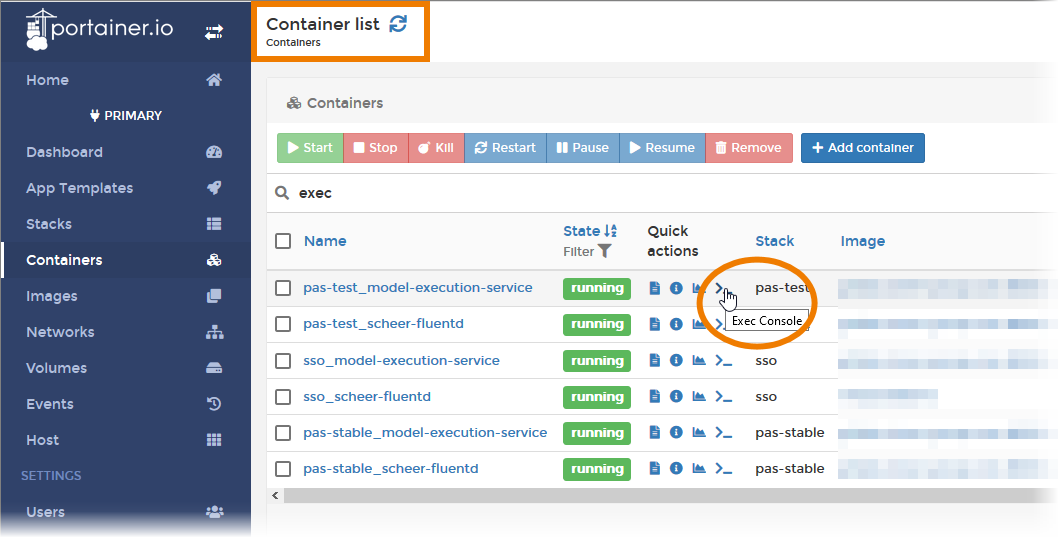
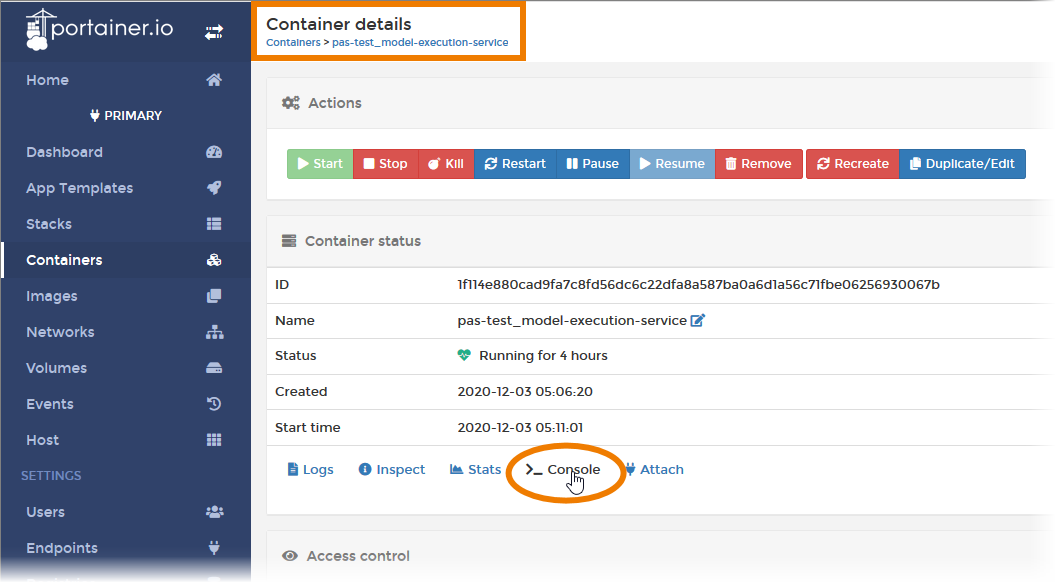
You have the possibility to attach to a shell inside the container to change some configuration. There are two ways to open the shell:
Click on the Console icon in the container list:
Open the container details and select option Console:
In the Container console window click the Connect button to open the console:
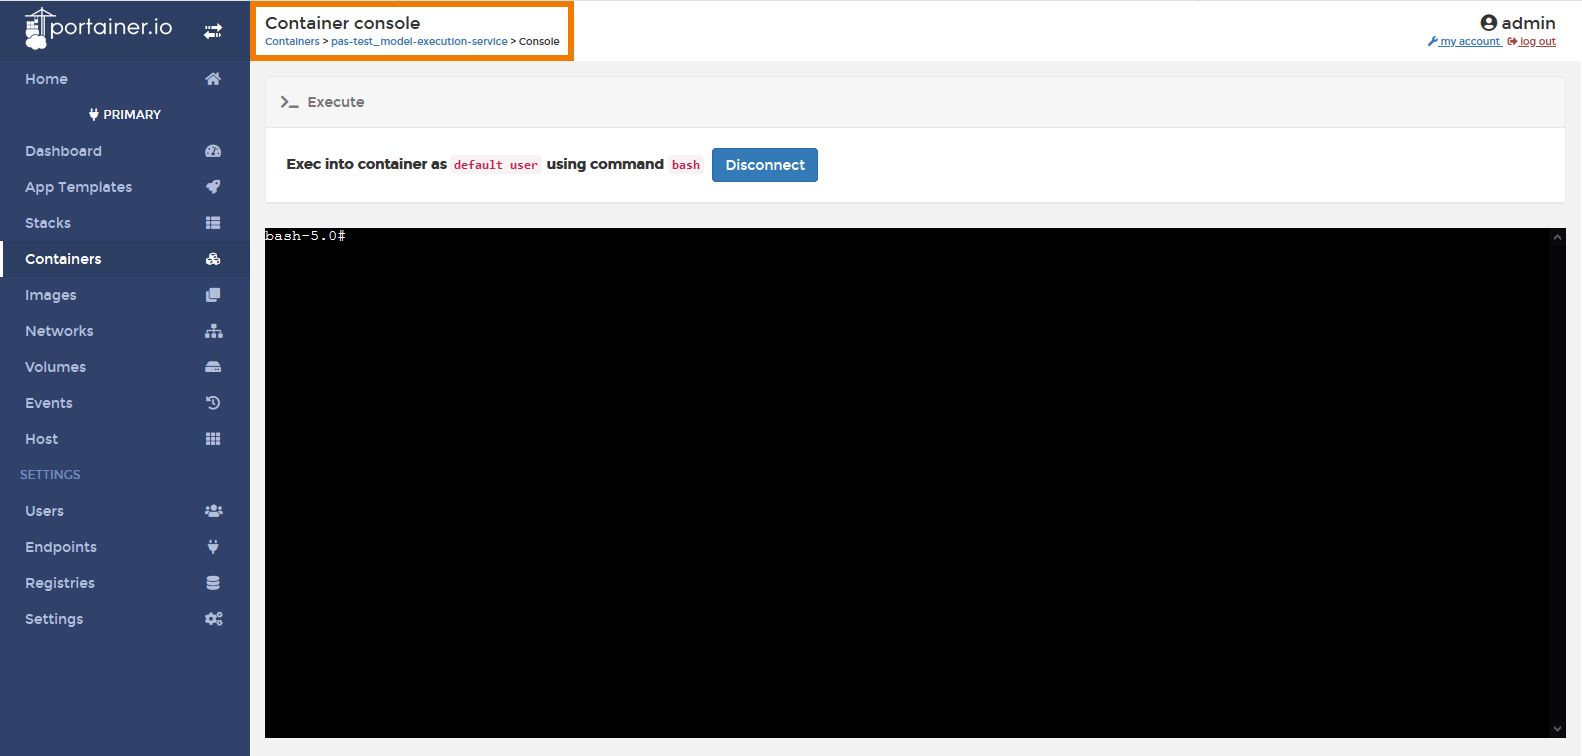
For detailed information see Access Container Console in the Official Portainer Documentation.
How to Change the Log Level
The default log level is warn (only warn and error are taken into account). You can change the log level, for example for debugging purposes.
Do not forget to reset the log level to the default after debugging. Otherwise, enormous amounts of data are generated, which can have a long-term effect on system performance.
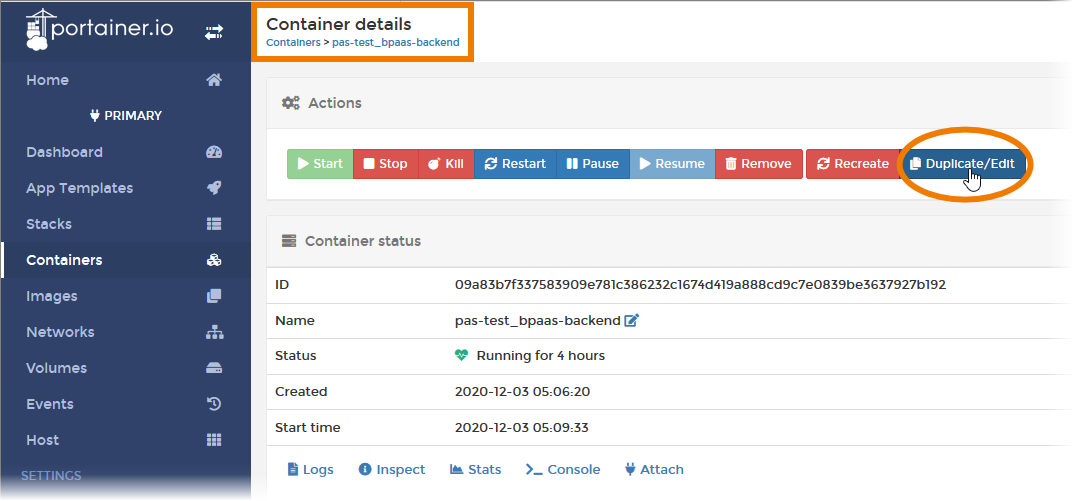
Open the container details and use the Duplicate/Edit button:
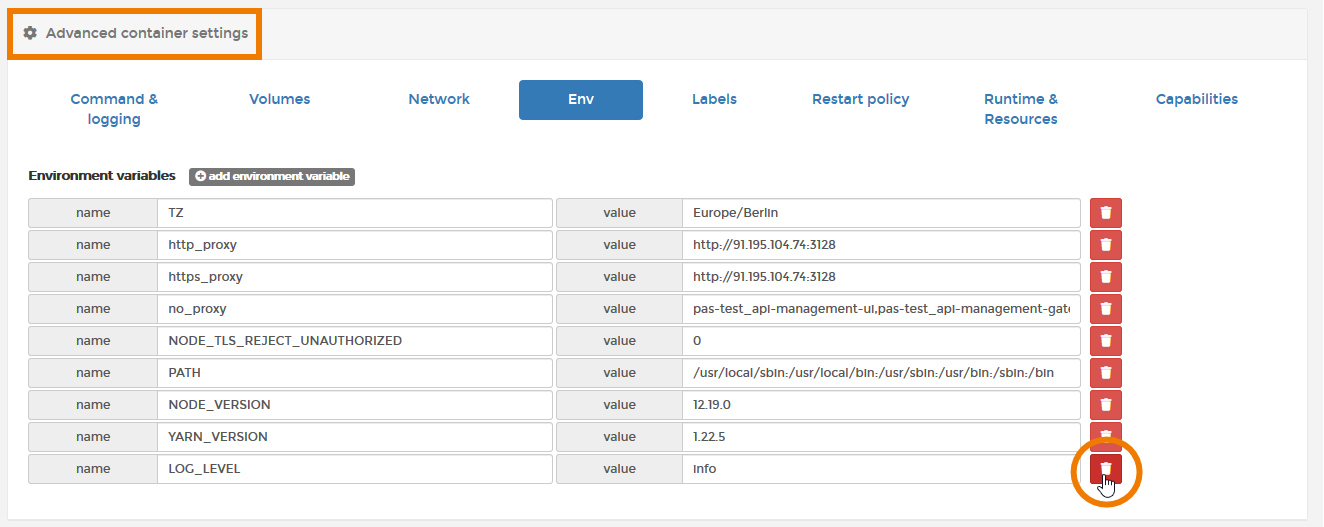
The Create container window opens. Scroll down to section Advanced container settings and click on the Env tab:
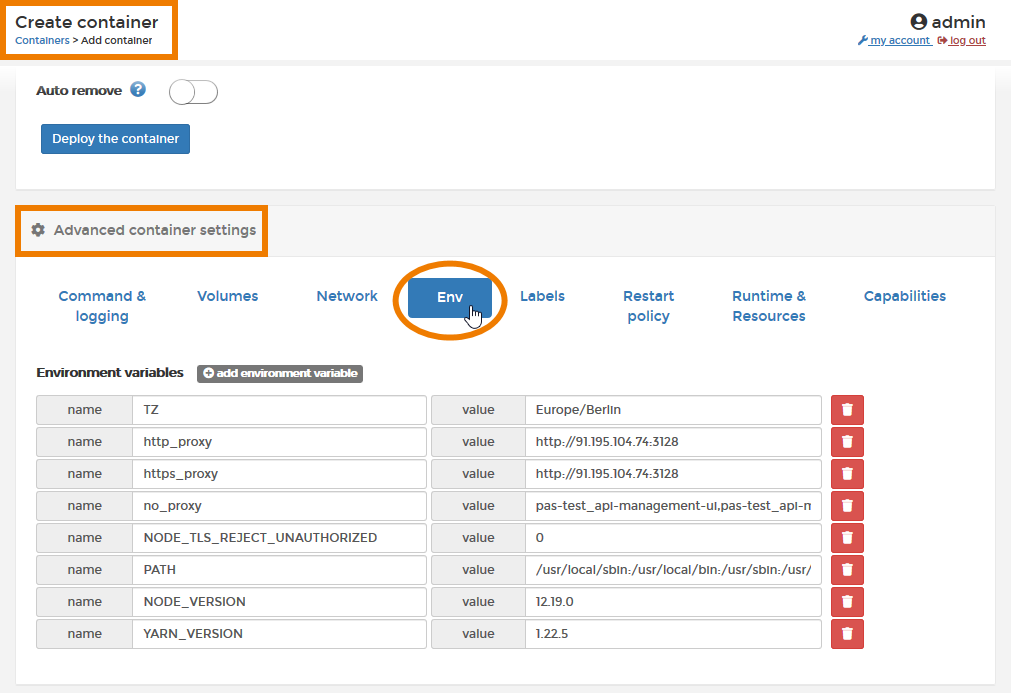
To change the log level, you need to add the variable LOG_LEVEL if it is not yet present. Use the +add environment variable button:
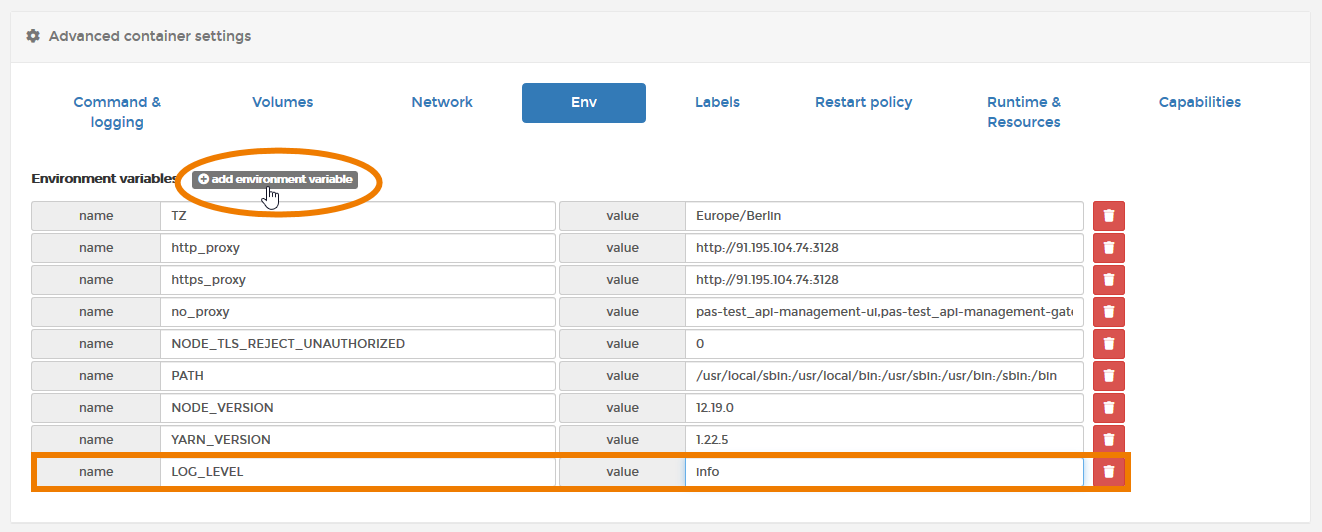
An empty line is added to the list. Enter the following:
-
name: LOG_LEVEL
-
value: Name of the desired log level, for example info
Available Log Levels
-
trace
-
debug
-
info
-
warn
-
error
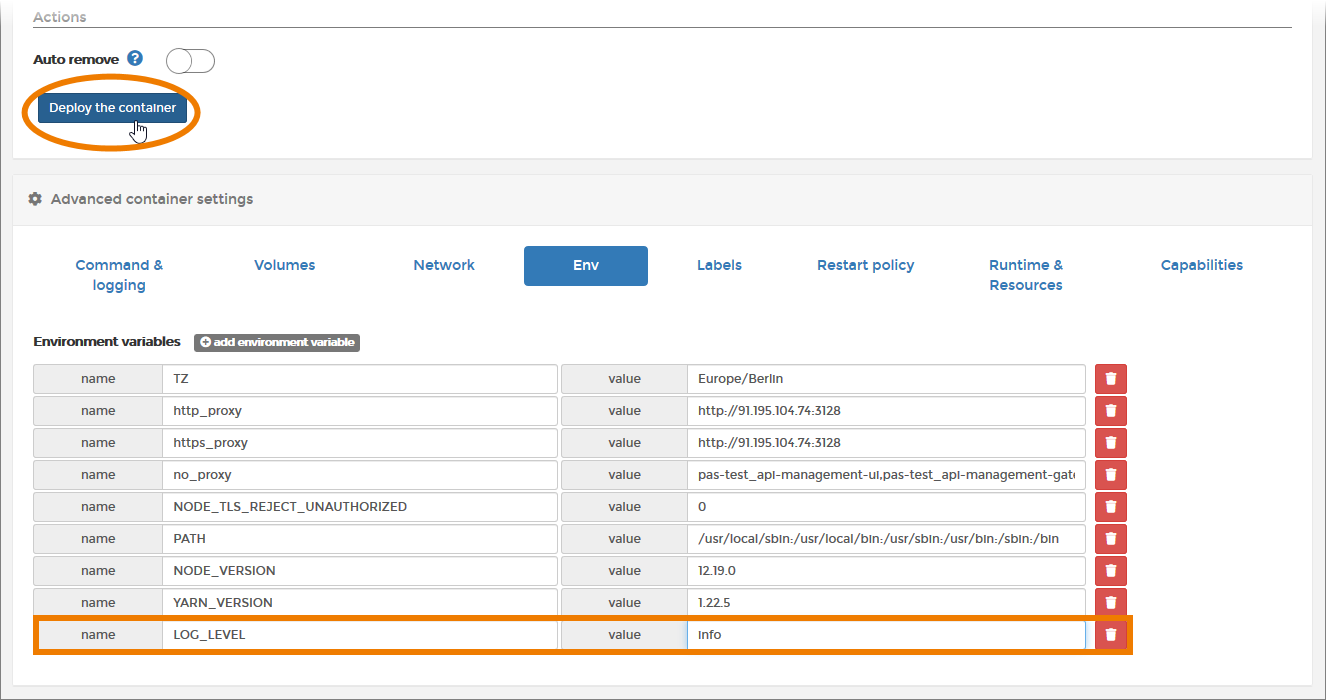
To apply the changes, you need to deploy the container. Click on the button Deploy the container. You will find it in section Actions:
Confirm the pop-up note as you want to replace the existing container:

You will be notified if the container has been created sucessfully. The note disappears after a while and the container list is displayed again:

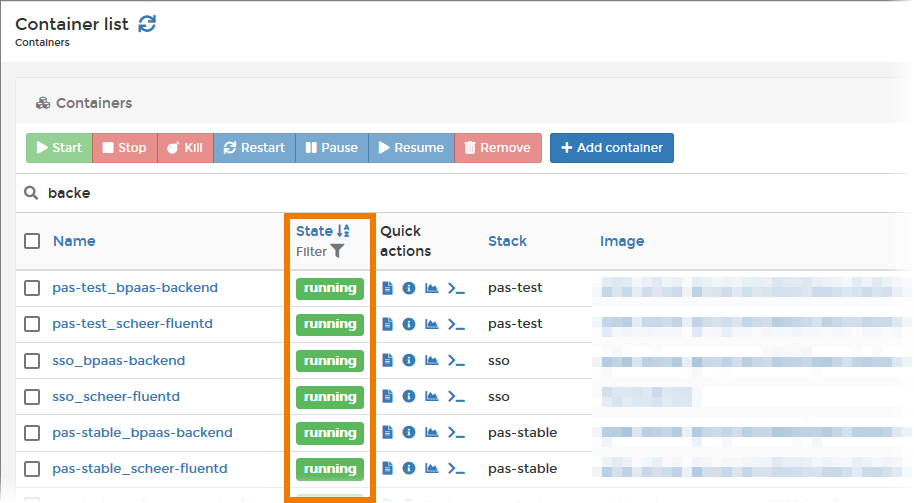
Use the list to check if the new container is up and running:
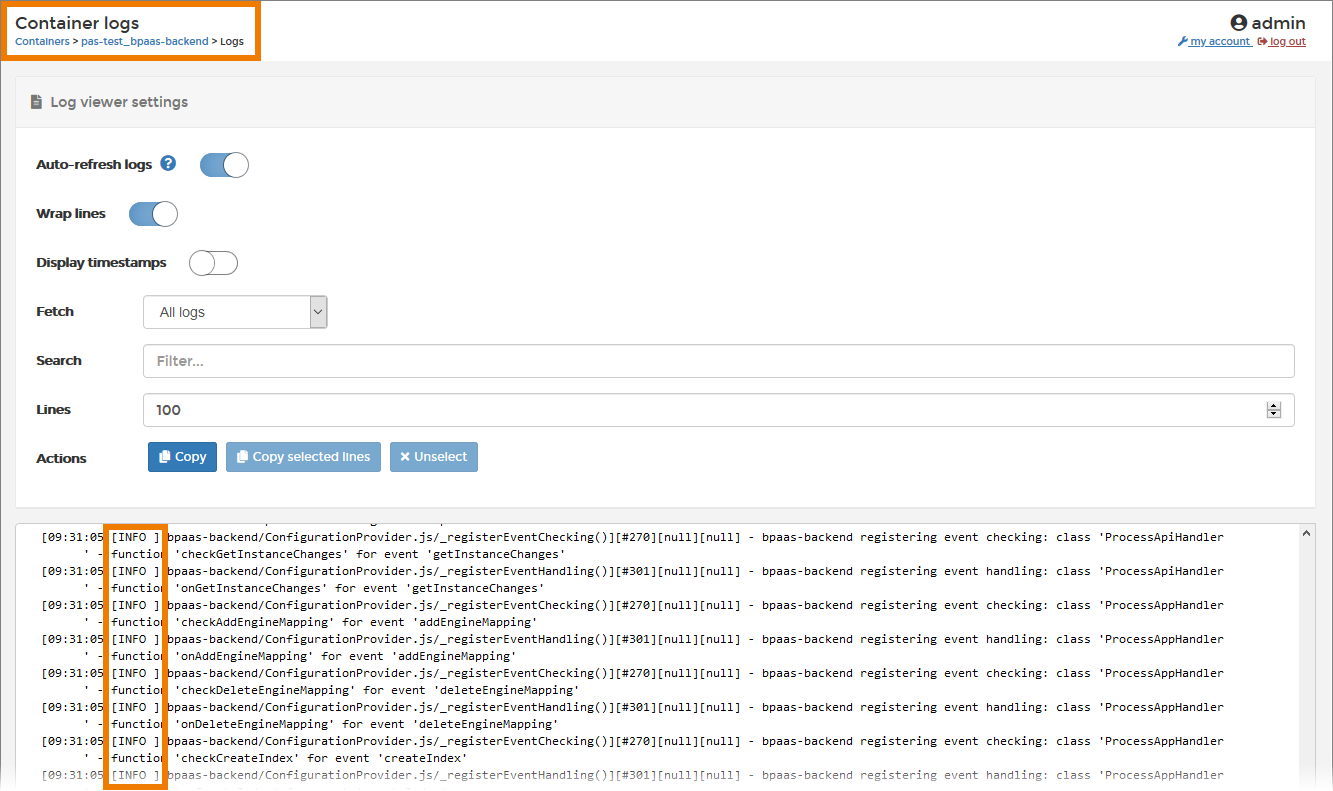
Now you can check if the changed levels are displayed in the logs. See section View Container Logs for details on how to access the logs:
Delete the added environment variable LOG_LEVEL after debugging and deploy the container again. The log level will then be reset to the default:
