To inspect and search the log data of your services, open the main menu on the start page and select Discover. Option Discover allows for
-
selecting log data for exploration.
-
setting a time range for the log data.
-
searching the logs with DQL.
-
filtering the results.
-
exploring the details of log entries.
-
configuring tables that show the search results.
Refer to Inspecting the Logs: Tips & Tricks for more information about the available query languages: DQL and Lucene.
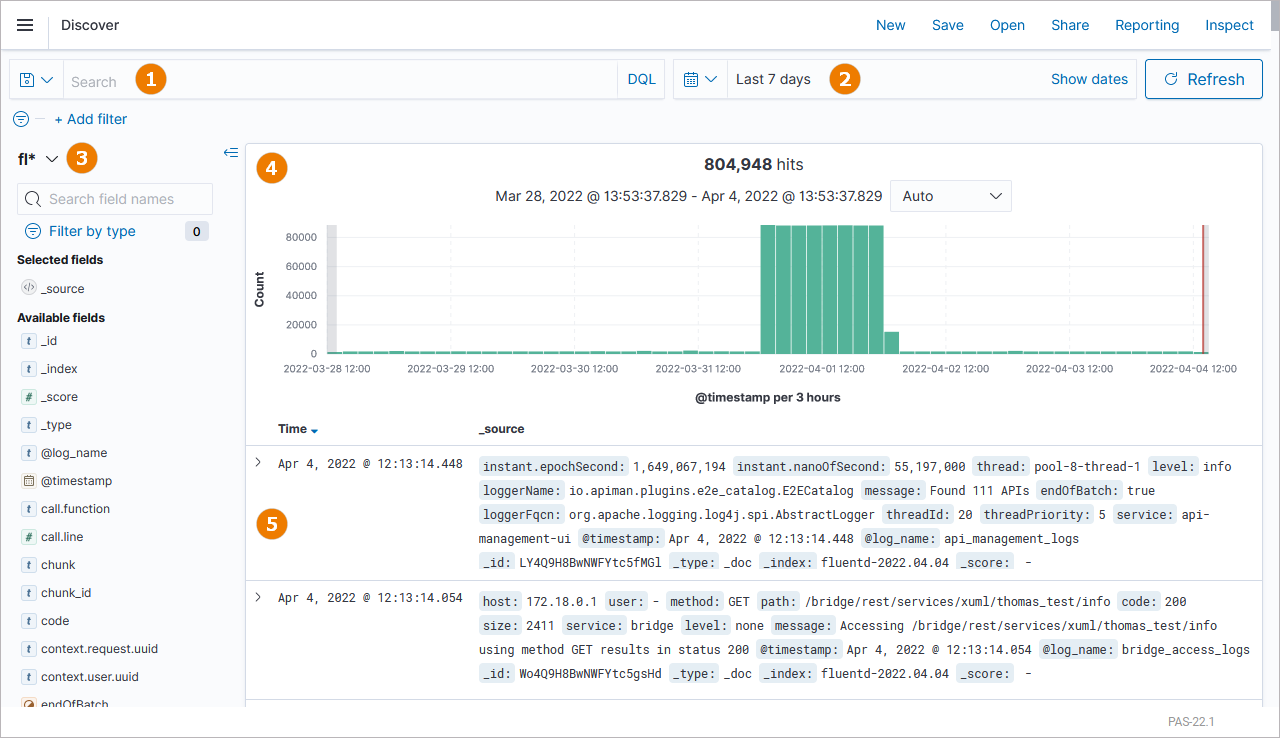
Overview on the “Discover” Page
|
(1) |
Search Query:
|
|---|---|
|
(2) |
Time Range:
|
|
(3) |
Sidebar:
|
|
(4) |
Time Histogram:
|
|
(5) |
Documents Table:
The retention time for logs in the Log Analyzer is 30 days. |
Displaying Search Results
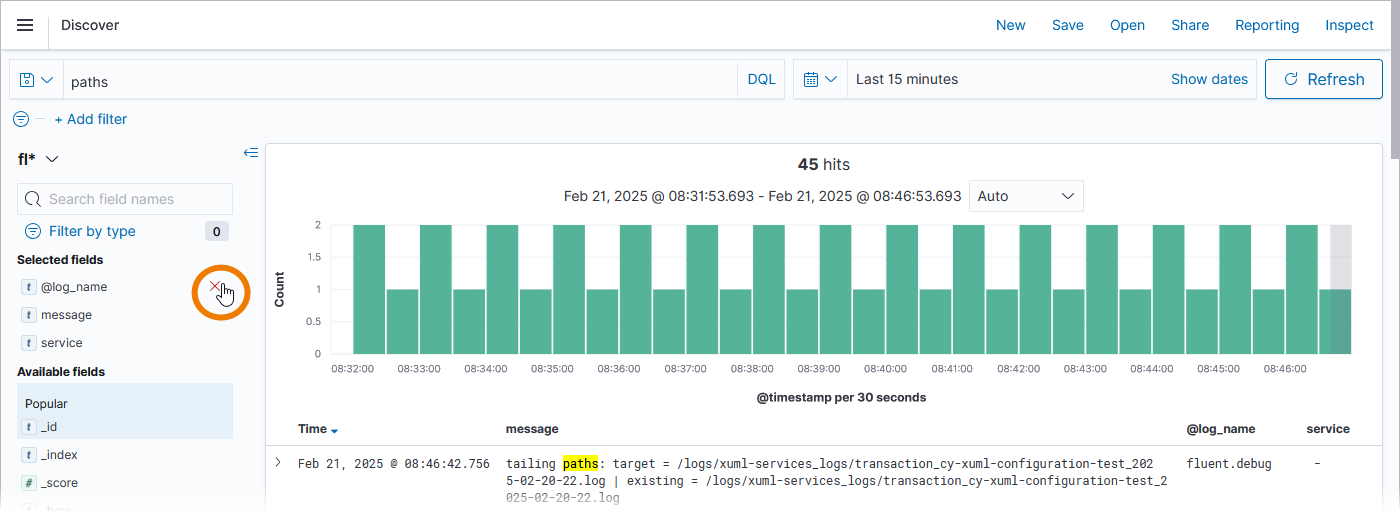
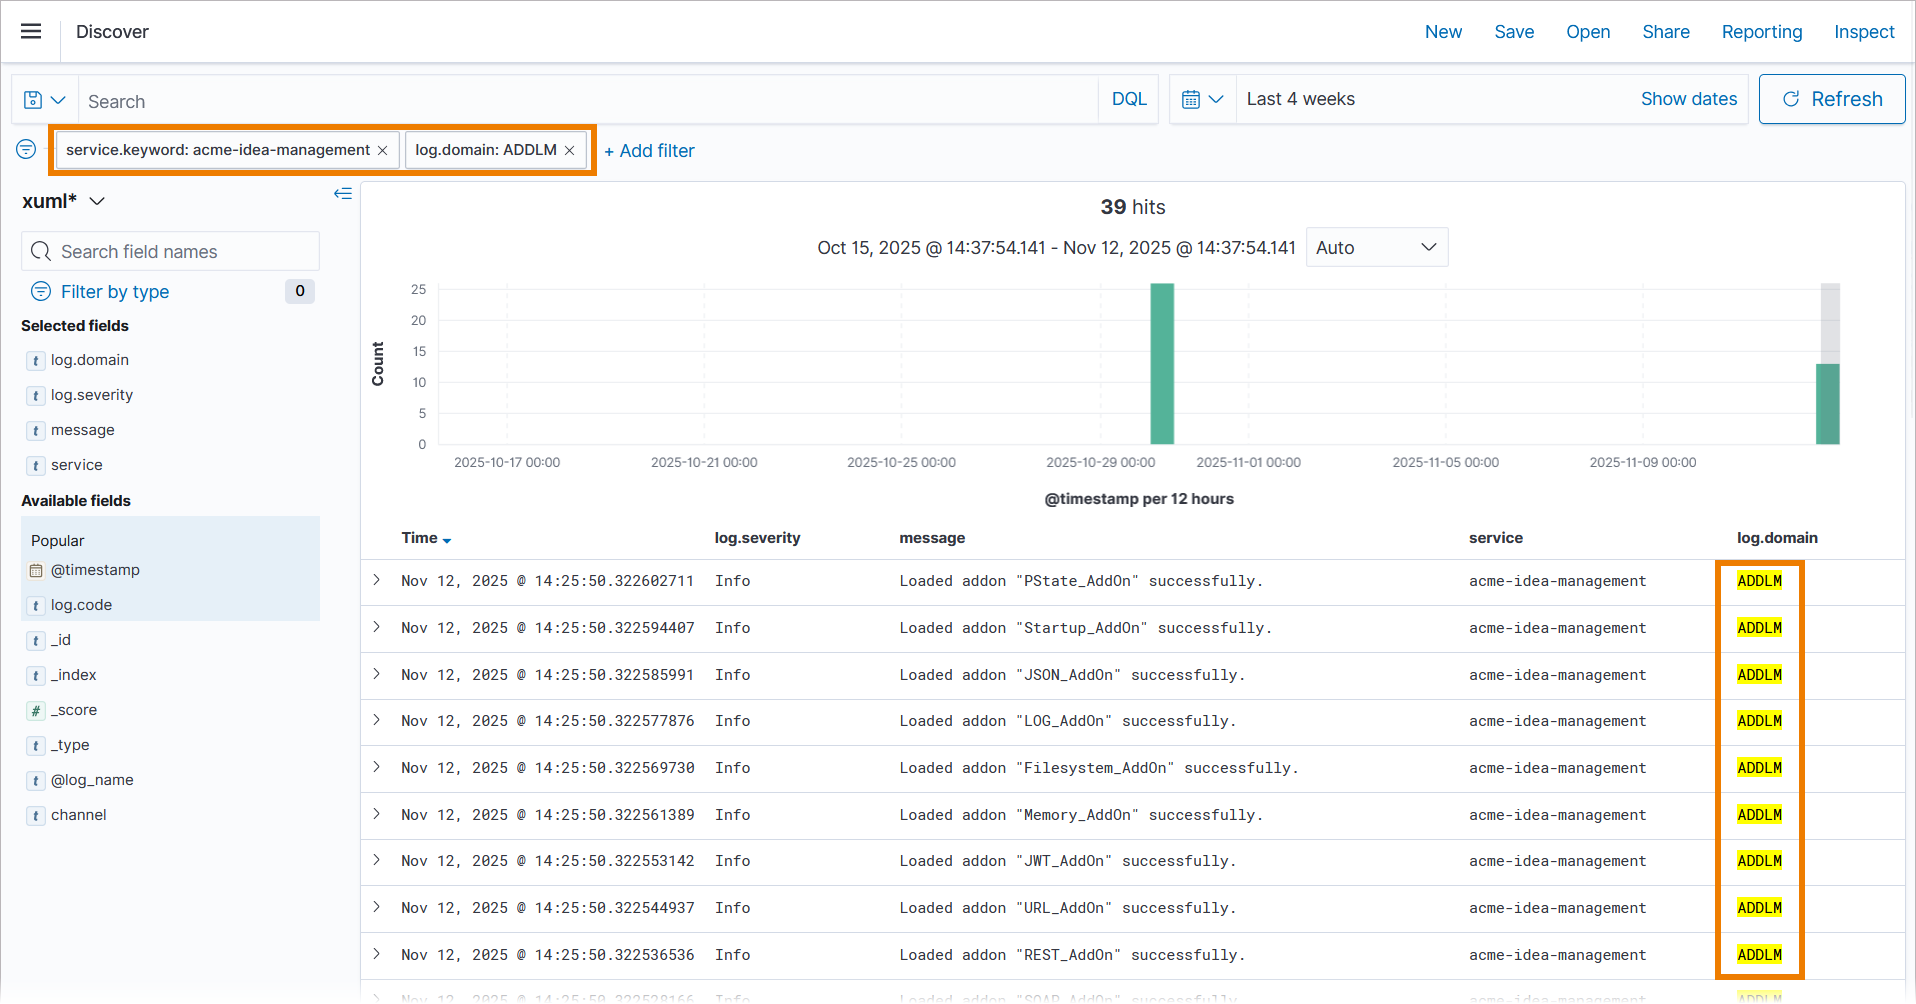
If you use DQL, your search term is applied to the field(s) set as the default field(s) on the index, search term hits are highlighted:
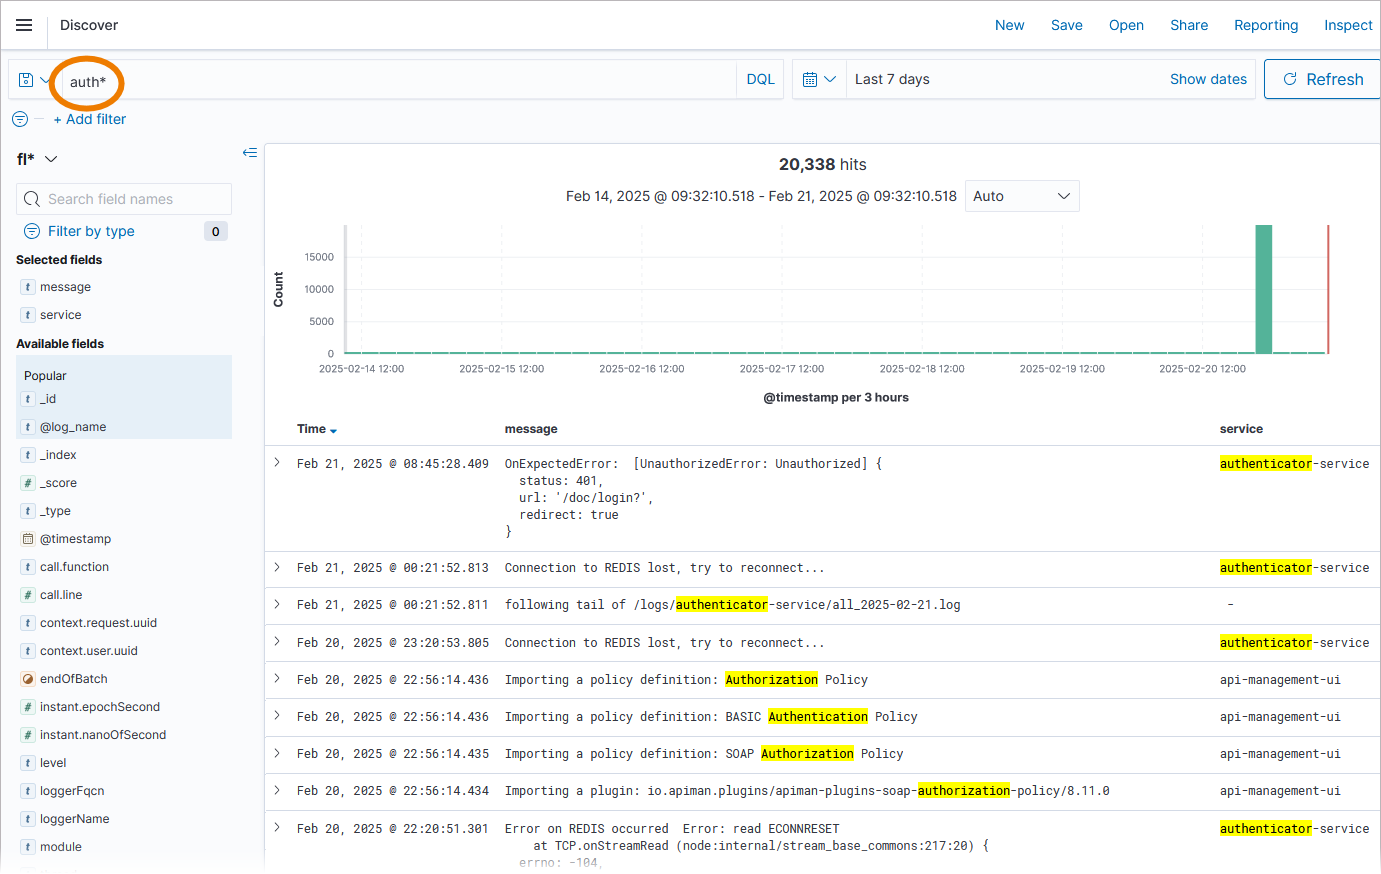
If no default field is set, DQL searches all fields.
The set default fields are displayed in the left sidebar as Selected fields. These fields are displayed as columns in the content area on the right:
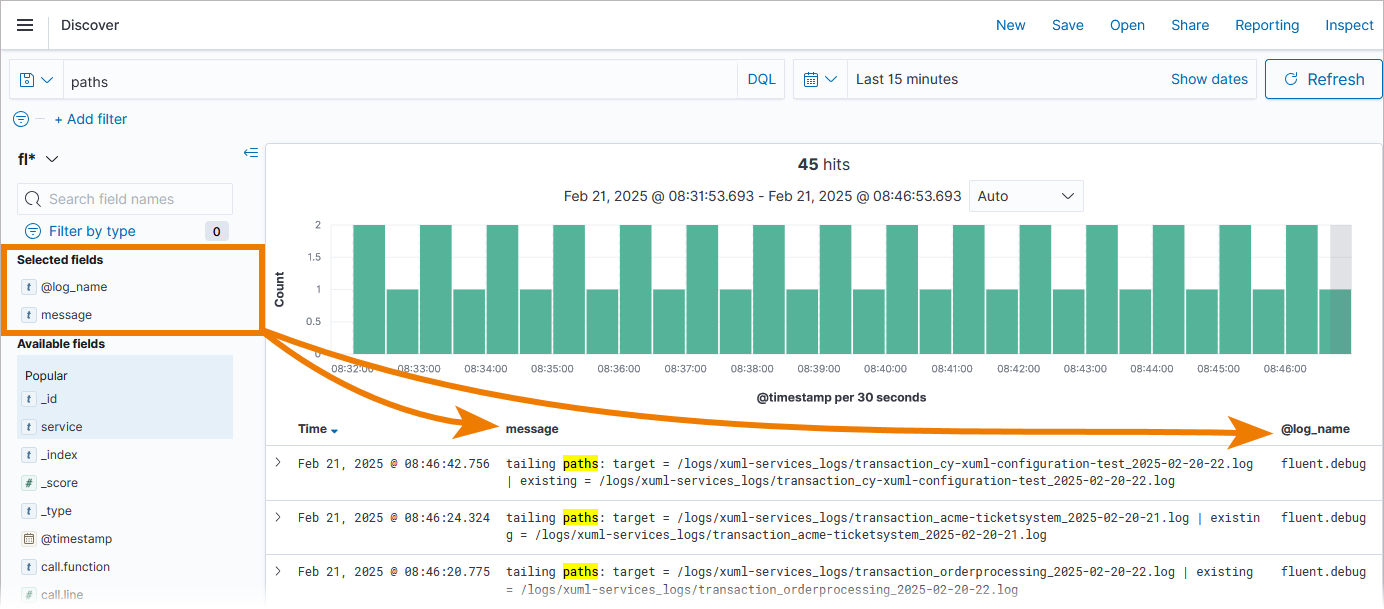
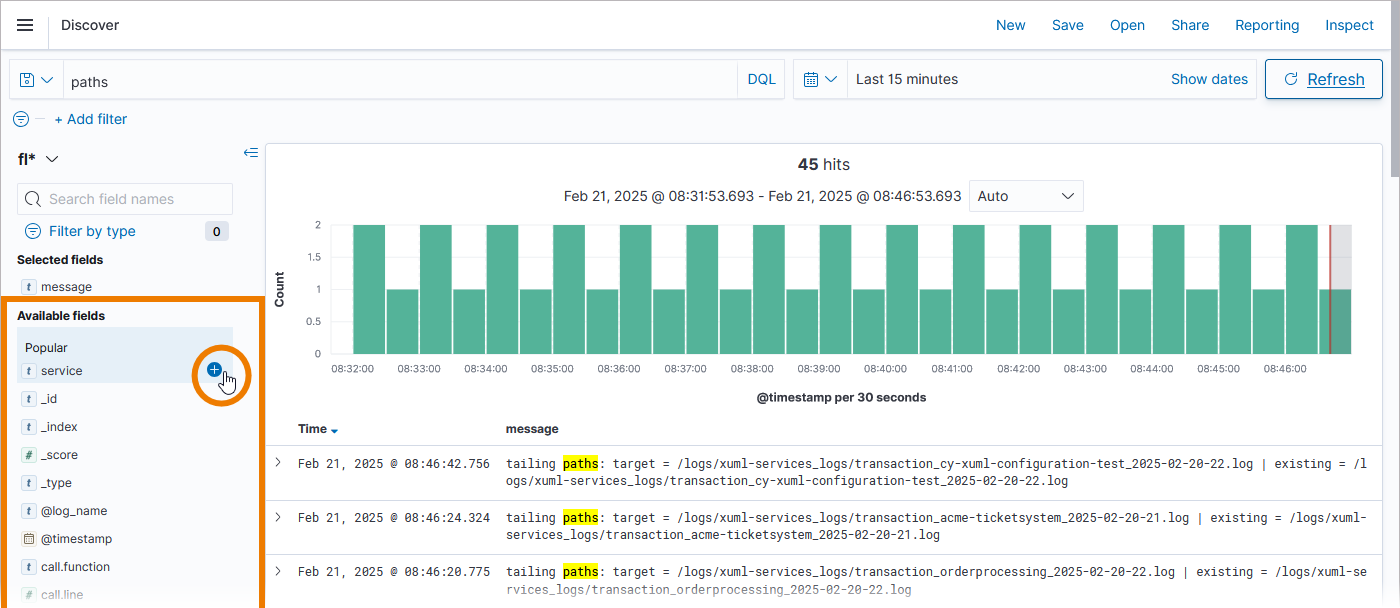
If you want to add a field, hover over a field name in section Available fields and click the appearing Plus option:
Hover over a field name in section Selected fields and click the appearing X option to remove a field:
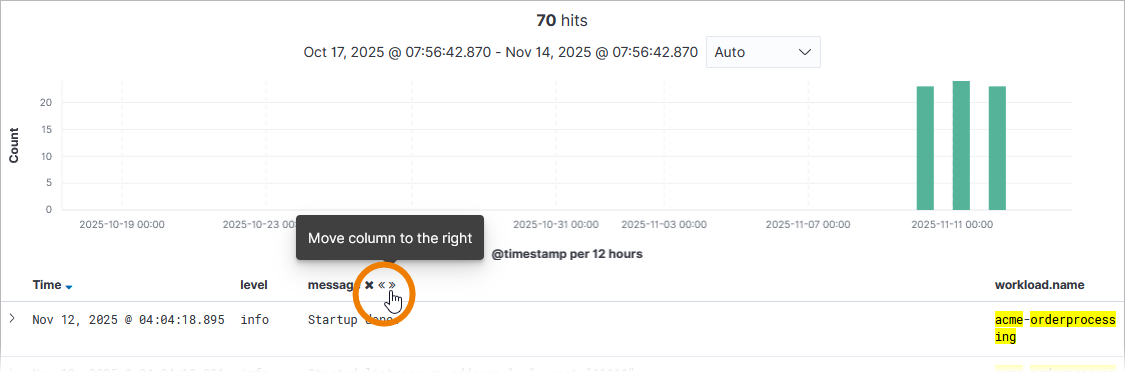
You can also remove fields directly from the table. Hover over a column to display its options. You can remove and sort displayed columns:
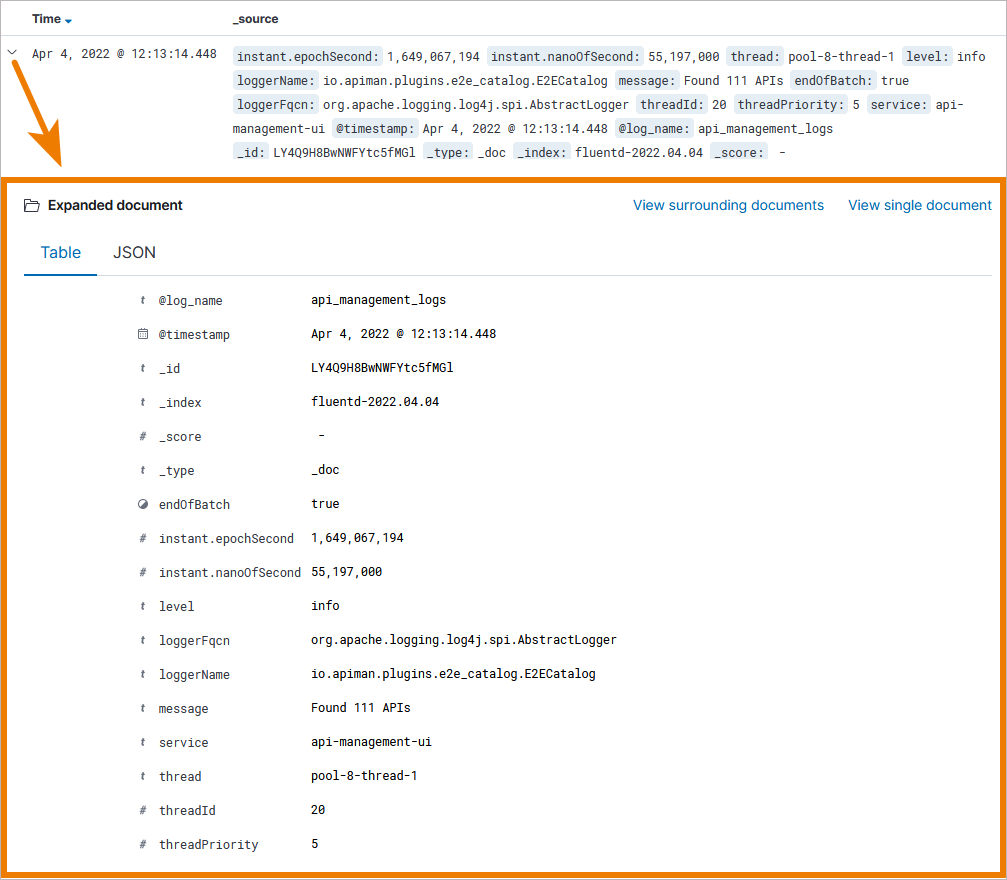
Expand a log document to show the fields that are available with this document:
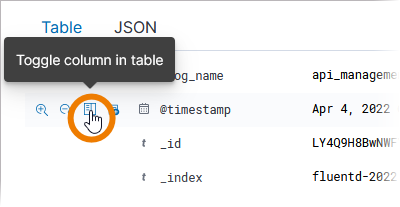
To add a field to the table display, click on its menu item Toggle column in table:
Once you have created a query, you are also able to save it for further use, for example in a dashboard or for an export.
Expert Tipp
To inspect the logs of a specific service, open the Log Analyzer from within the service details in the PAS Administration.
Docker Setup:
In the service details, open section Logs and use option Open Log Analyzer to inspect logs.
The Log Analyzer will open, showing all logs of this specific service.
Refer to Showing Docker Container Logs and Docker: Showing Logs of a Containerized xUML Service for more details.
Kubernetes Setup:
On a Kubernetes system, section Logs in the service details is divided in two parts: Service Logs and Transaction Logs.
In both parts you can find a button to open the Log Analyzer:
-
Open Service Logs: Shows the logs filtered by service name and log channel container.
-
Open Transaction Logs: Shows the logs filtered by service name and log channel transaction.
Refer to Showing Workload Logs and Kubernetes: Showing Logs of a Containerized xUML Service for more details.
Docker Examples
In PAS Docker setups, the most important fields you need are:
-
service (= service name)
-
message (= log message)
Check Inspecting the Logs: Tips & Tricks for helpful hints about searching logs.
Filter Example xUML Service
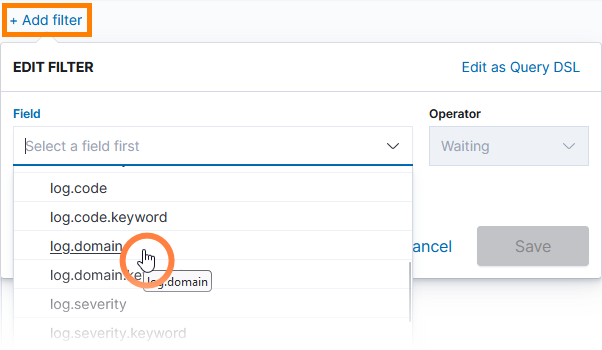
With xUML services it is a common task to search for log errors with a certain error domain. To filter for a dedicated error domain (RESTLM in this example), add a filter for log.domain:
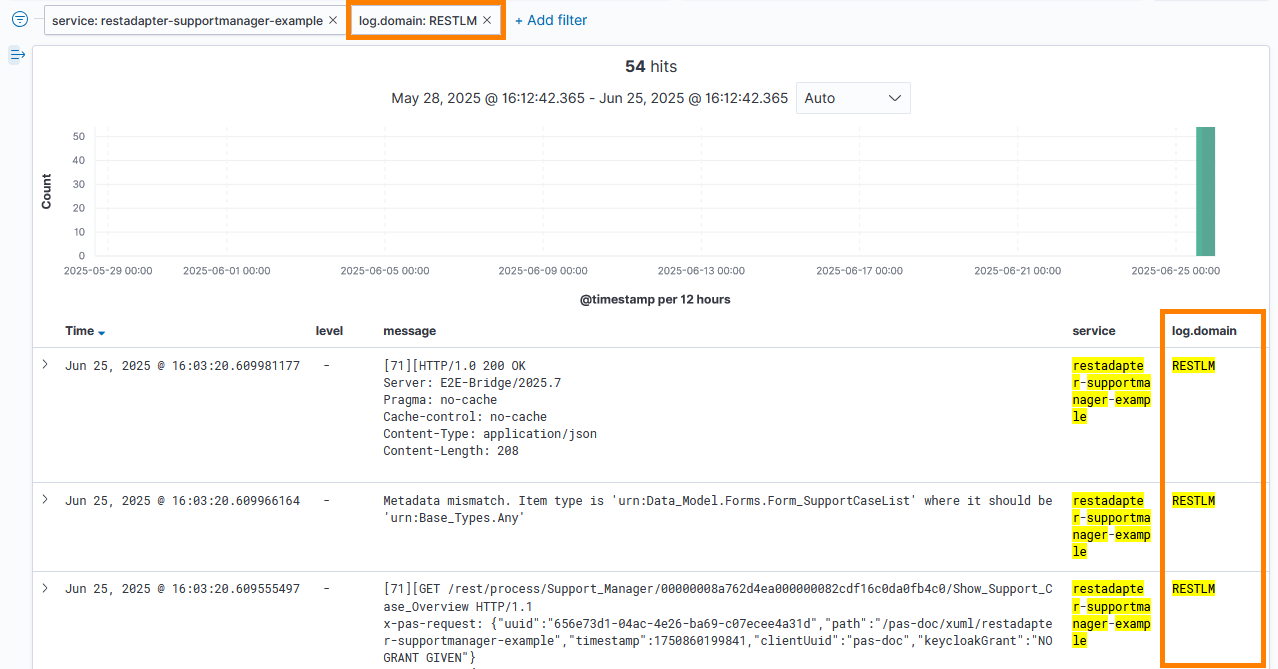
As a result, the search results are filtered for logs with the given domain:
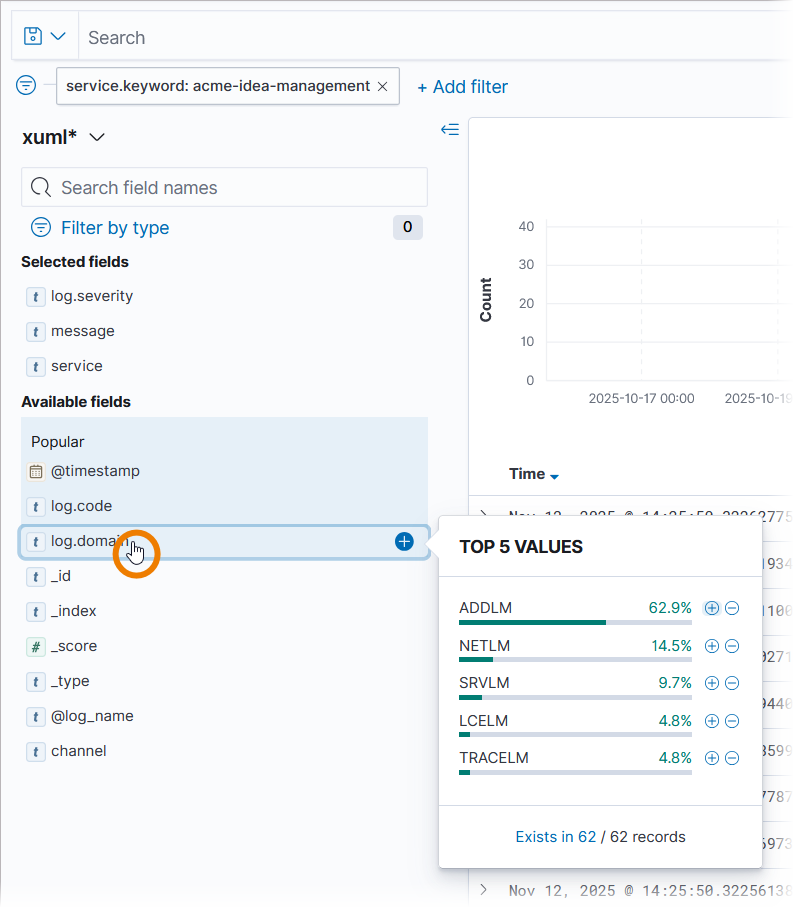
There is a second way to achieve the same goal. In the list of Available fields click on the name of the field you want to filter, here log.domain. This opens a pop-up showing the Top 5 Values:
Click + on the value you want to filter for:
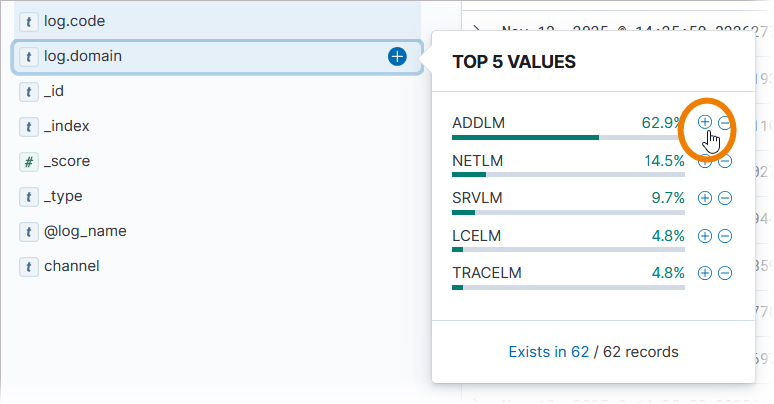
The filter is added and applied to the list:
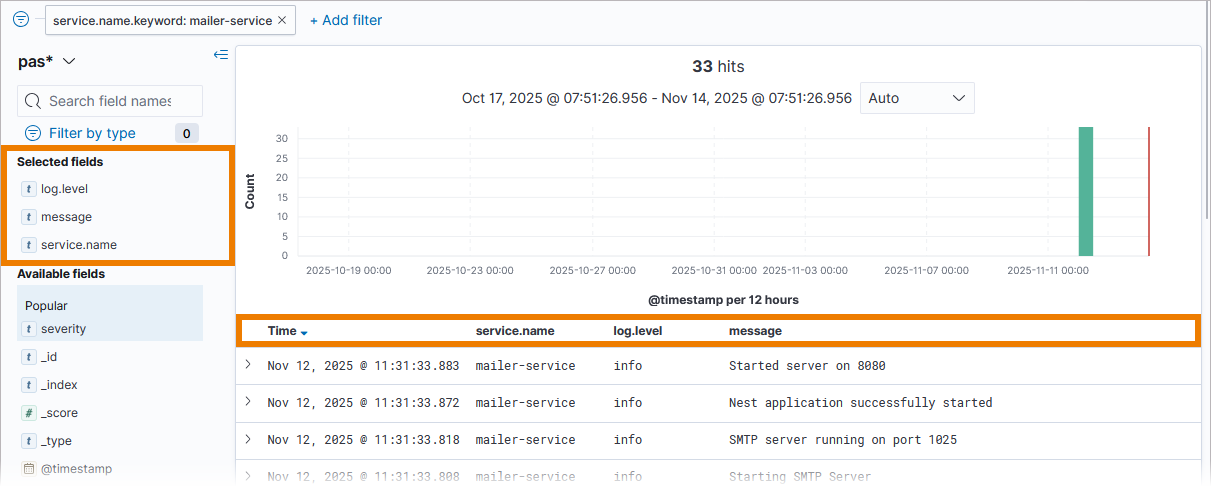
Display Example Node.js Service
To inspect logs of Scheer PAS Node.js services, you can for example select the following fields to be displayed:
-
time (displayed by default)
-
service.name (= name of the service)
-
log.level (= log level)
-
message (= log message)
Kubernetes Examples
In PAS Kubernetes setups, the most important fields you need are:
-
workload.name (= service name)
-
workload.type (= type of service, e.g. xuml, nestjs, etc.)
-
message (= log message)
Check Inspecting the Logs: Tips & Tricks for helpful hints about searching logs.
Filter Example xUML Service
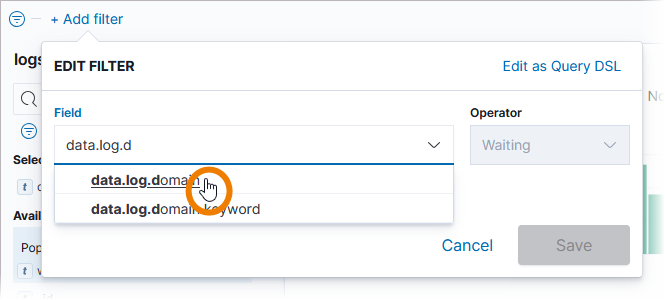
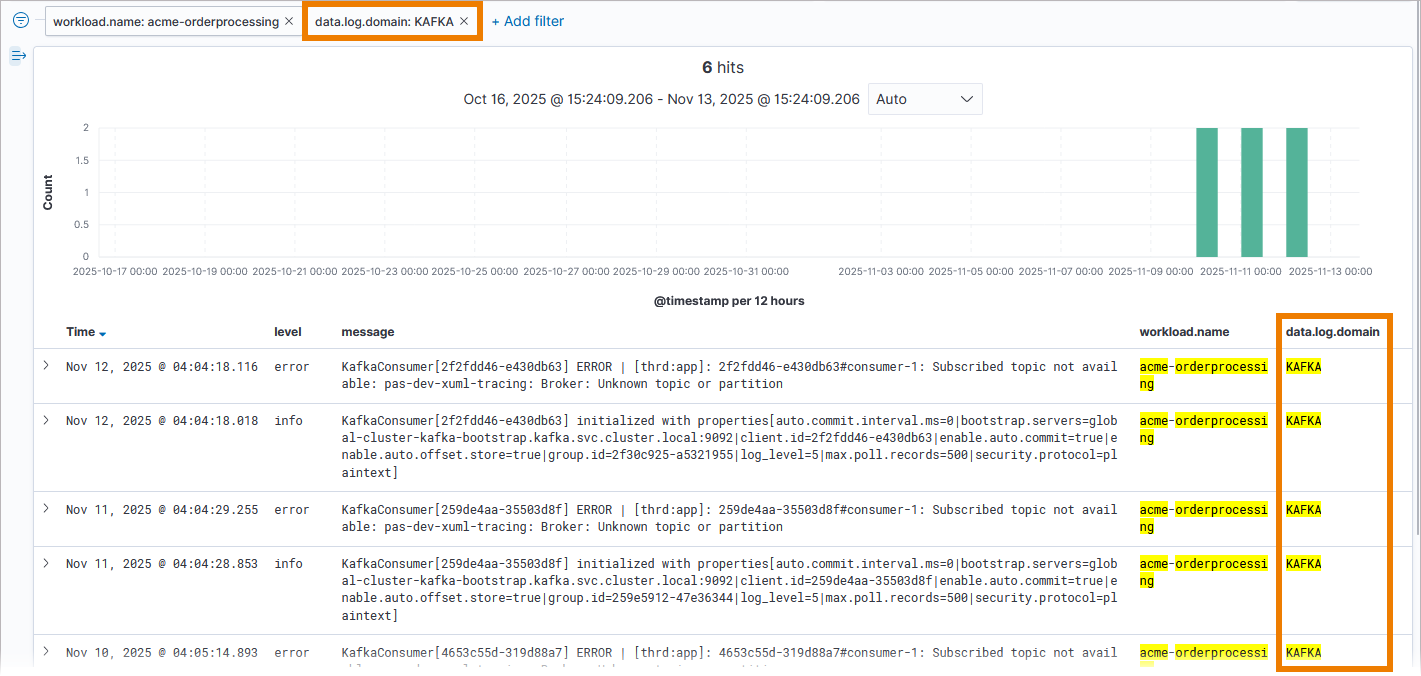
With xUML services it is a common task to search for log errors with a certain error domain. To filter for a dedicated error domain, add a filter for data.log.domain:
As a result, the search results are filtered for logs with the given domain:
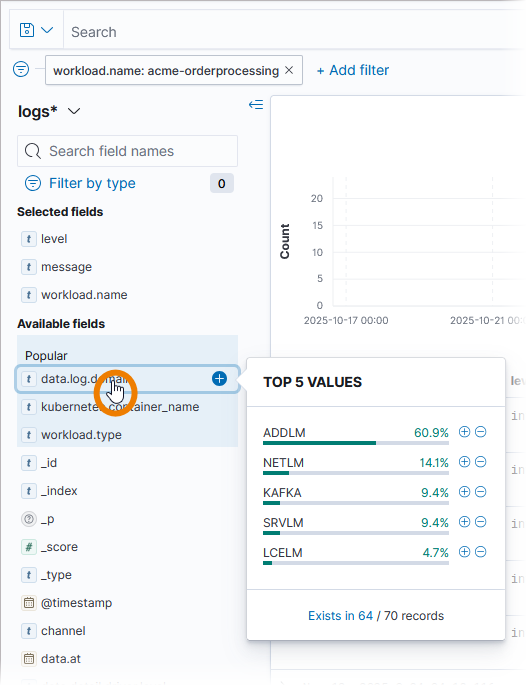
There is a second way to achieve the same goal. In the list of Available fields click on the name of the field you want to filter, here data.log.domain. This opens a pop-up showing the Top 5 Values:
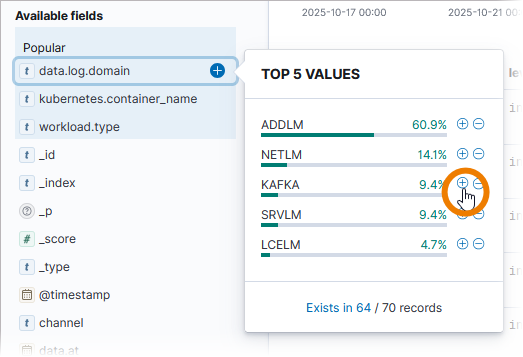
Click + on the value you want to filter for:
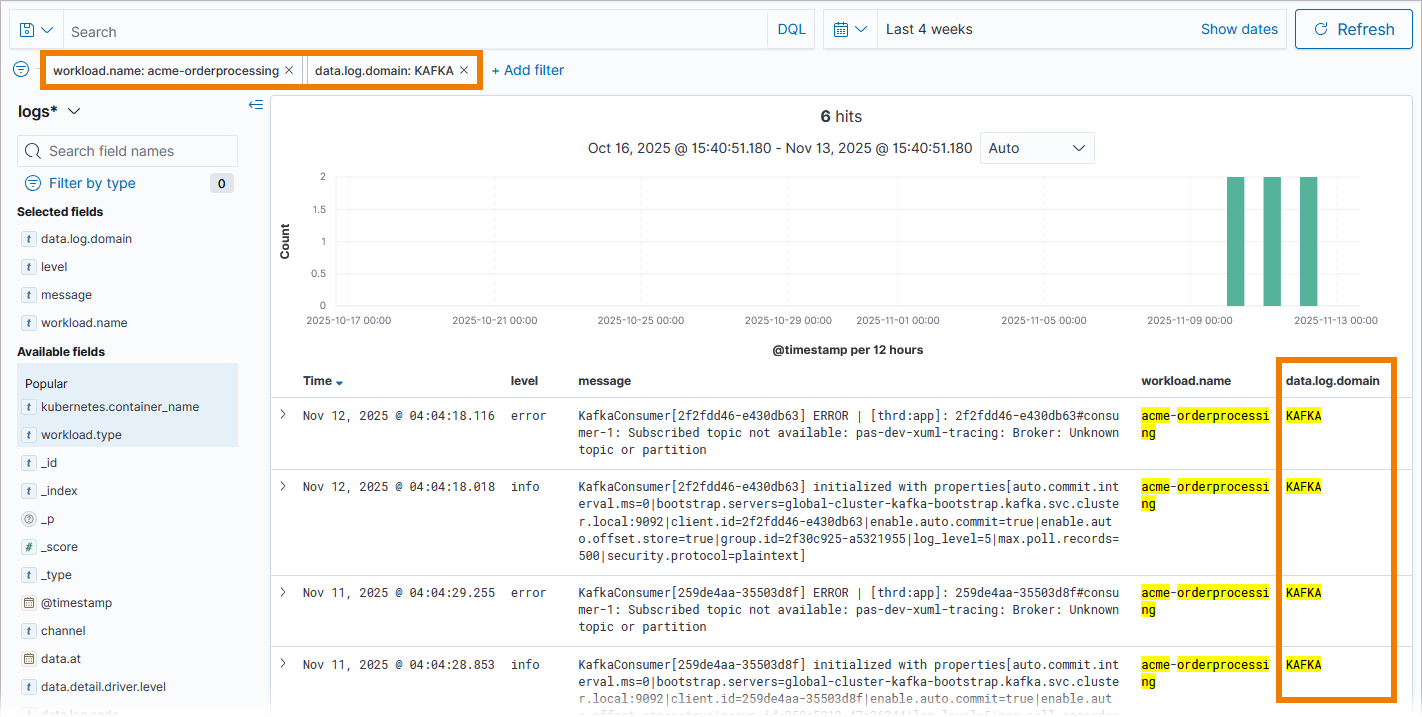
The filter is added and applied to the list:
Display Example Node.js Service
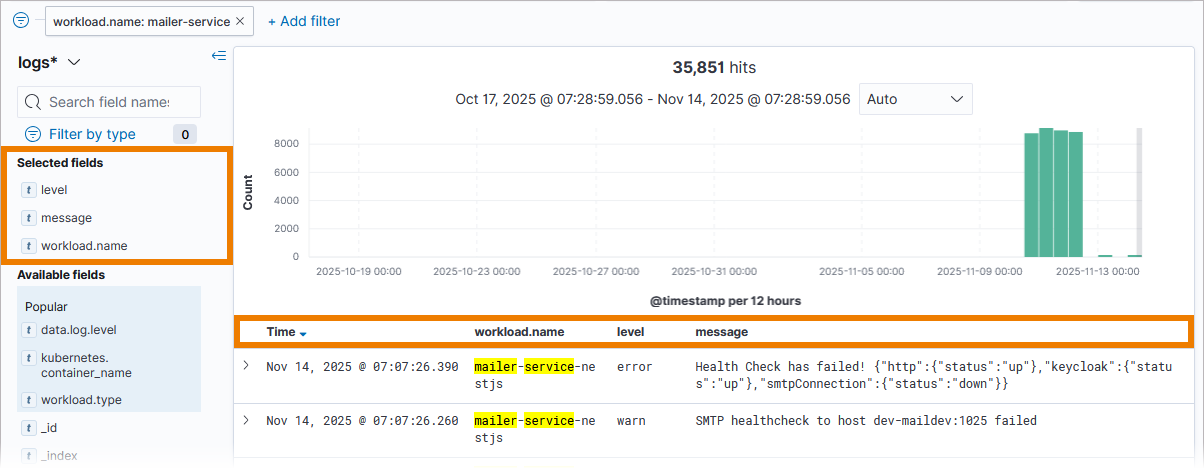
To inspect logs of Scheer PAS Node.js services, you can for example select the following fields to be displayed:
-
time (displayed by default)
-
workload.name (= name of the service)
-
level (= log level)
-
message (= log message)
Related Content
Related Documentation: