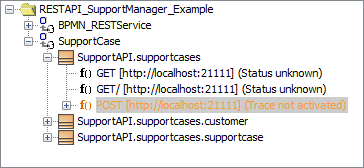
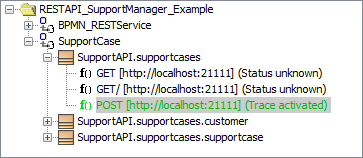
After having imported the service description, all service resources are listed in the asynchronous (lower) part of the Trace Analyzer.
You can find the following:
A node for each service.
REST resources within that service that describe service interfaces.
REST endpoints provided by the resources.
Also, the state machine of each BPMN process will show as a node (this service has no process).
Service Resources Overview
An xUML service that has been compiled with the Designer contains some standard elements (see list below). Depending on what you want to inspect, you need to connect to a different element of the service. Find below a table listing all available resources from an xUML service.
|
Type |
Description |
Inspection Possibilities |
Example |
|||
|---|---|---|---|---|---|---|
|
|
State Machine |
State machine that represents the states of the BPMN process. |
|
|
||
|
|
Service |
Group of REST resources provided by the xUML service. |
|
|
||
|
|
REST Resource |
REST resource that is available within the service (top node). Resources are generated for:
|
|
|
||
|
|
Operation |
Operation that can be used to access the REST resource. |
Depending on the resource:
|
|
||
Refer to How BPMN Elements Are Generated to xUML for hints which element to inspect for what use case.
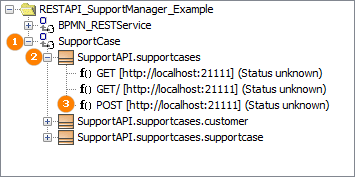
Configuring the Connection Properties
You need to connect each resource/operation you want to inspect to the deployed service, and enable trace (see list of elements above). Select the element you want to inspect:
Refer to How BPMN Elements Are Generated to xUML for hints which element to inspect for what use case.
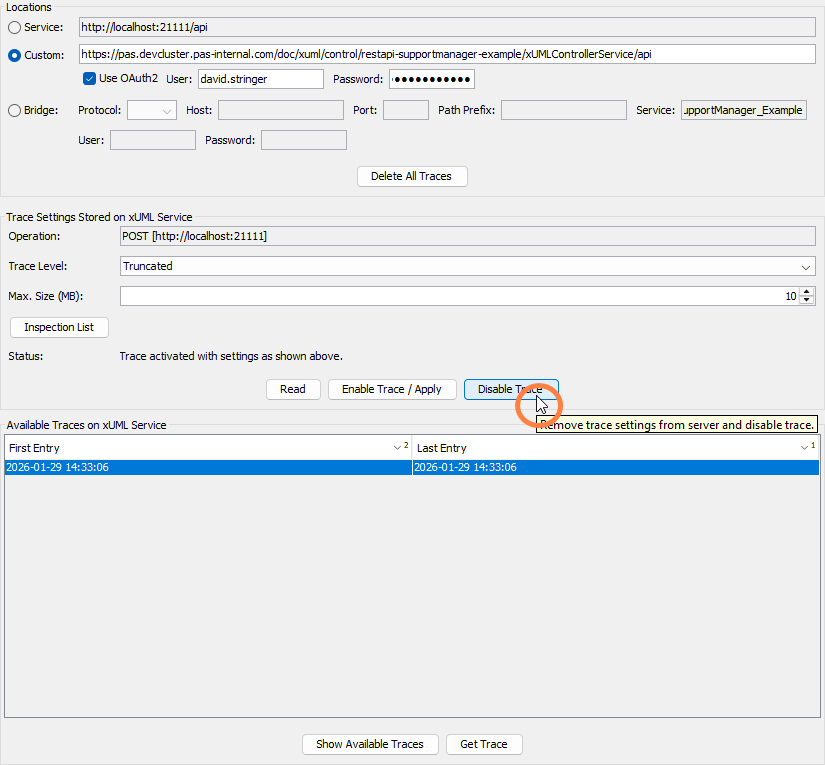
The content pane on the right displays the trace settings and actions for the selected element. The upper part of the content pane displays the configuration details:
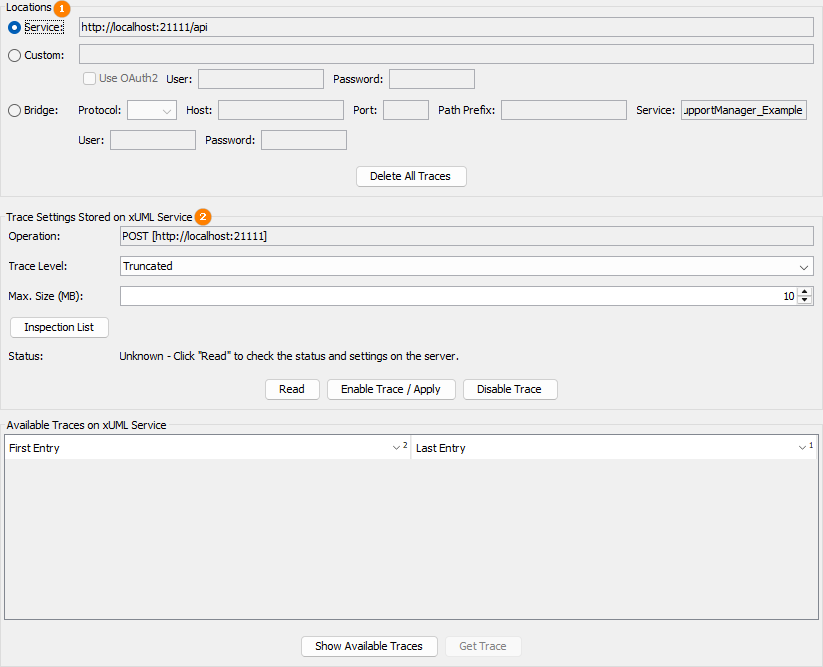
the service locations
the trace settings
Service Locations
You have different configuration possibilities, depending on where your service is running.
-
Service
This setting is not applicable for Designer services. -
Custom
Use a custom service location to connect to-
a Designer service that is running on a Kubernetes or Docker PAS environment, or
-
a service that is running in the Designer test environment, and where you do not need to authenticate.
-
-
Bridge
This setting is not applicable for Designer services.
Custom Location for Deployed Designer Services
|
URL |
Specify the xUML Runtime control URL of the service as visible from the administration (see Controlling Containerized xUML Services (Docker) > Endpoints for more). |
|
|
Use OAuth2 |
Check to be able to provide credentials for your connection. |
|
|
User/Password |
Provide a valid user and password to connect to the service. |
|
Custom Location for Test Environment
|
URL |
Specify the URL to the service. For further information on how to get the URL of the service running in the test container, see below. |
|
|
Use OAuth2 |
Not required |
|
|
User/Password |
Not required |
|
How to Get the Custom Location for the Test Environment
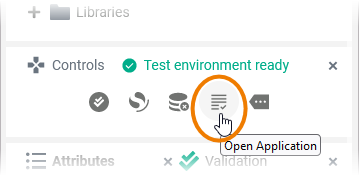
Open the application of the respective service in the test environment of the Designer. Use option Open Application in the Controls panel:
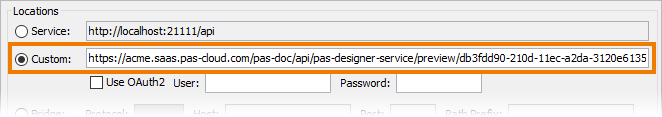
The application opens in a new tab. Copy the URL of the application (including the unique id, up to angular/ui/...) from the address bar of your browser, and paste the URL to the field Custom in section Locations of the Analyzer:
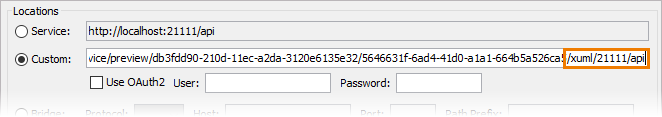
Append /xuml/21111/api to the URL:
Trace Settings
You can configure the tracing process itself using the following settings:
|
Setting |
Description |
Possible Values / Examples |
|
|---|---|---|---|
|
Trace Level |
Specify the trace level: truncated or full. |
Truncated |
Collect limited tracing information from the service (default):
This option is useful for services with high data load. |
|
Full |
Collect a full trace, means all runtime values without limitations. This may result in a large amount of storage capacity being used. |
||
|
Max. Size (MB) |
Limit the size of the trace being collected to a certain amount of disc space. |
10 |
The default is 10 MB. |
|
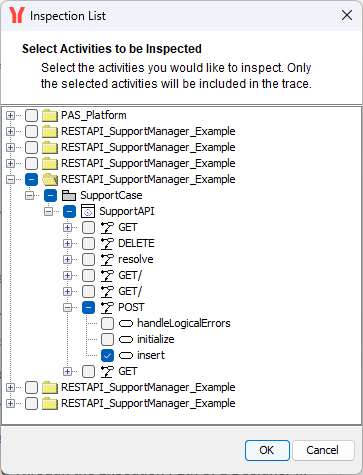
Inspection List |
Limit the amount of data collected by selecting only certain parts of the execution path that should be traced. |
|
|
Start Tracing
Once you have configured the service location and the trace settings as required, you can activate the tracing by clicking Enable Trace / Apply.
Also use this button after you have changed some of the configurations and want to apply the changes.
The Trace Analyzer displays trace being active on the selected element by highlighting it with green color:
Be aware of the fact, that trace is now enabled on the service. Even if you close the Analyzer now, trace is still running on the service, data being collected, and stored to the service context.
Keeping trace running on multiple services may lead to file storage issues on your server.
Click Disable Trace (see Stop Tracing below) to stop tracing the service.
Stop Tracing
After you are done with tracing, disable trace by clicking Disable Trace.
The Trace Analyzer displays trace being not activated on the selected element by highlighting it with orange color: