|
A |
|
BPMN |
EPC |
|
Axis allocation |
Using axis allocation, it is possible to freely assign process attributes to the axes of a diagram. Note: The term "axes" is mainly used for Cartesian charts (bars, columns, lines). Analogous to this, more appropriate terms are used for polar charts (circle, network) and the tachometer chart. |
|
|
|
Analysis |
The term analysis denotes a visualization of key process indicators placed on the Process Mining user interface with settings applied (chart type, process, axis allocation, filter). |
|
|
|
C |
|
|
|
|
Chart |
The graphic representation of an analysis. |
|
|
|
Content area |
User-specific active dialogue window on which the user can place his analyses. |
|
|
|
Current step |
The term current step denotes the process step in which an instance is currently found. The current step is an instance attribute that can be allocated to an axis when an analysis is created. |
|
|
|
E |
|
BPMN |
EPC |
|
End event |
The end event shows the event that closes an instance. The end event is an instance attribute that can be allocated to an axis when an analysis is created. |
End Event |
End Event |
|
EPC |
Abbreviation for event-driven process chain. An EPC graphically represents business processes by depicting processes and work steps. In Scheer PAS BPaaS EPC models form the basis for process apps with which business processes can be executed directly. |
|
|
|
F |
|
BPMN |
EPC |
|
Filter |
Limitation of the number of process instances that are to be used for evaluation as part of an analysis. |
|
|
|
H |
|
BPMN |
EPC |
|
Host |
The term host denotes the server on which the service runs and which executes the process to be analyzed. Host is an instance attribute that can be allocated to an axis when an analysis is created. |
|
|
|
I |
|
BPMN |
EPC |
|
Idle time |
The idle time comprises the period of time that elapses without the process being run (idle time = end of process step A to the start of process step B). |
|
|
|
Instance attribute |
Attribute of a process that is used to classify a process instance (for example, the item group in a sales process) or evaluates a process instance (for example, the sum total in a sales process). Classifying instance attributes are mapped on the x-axis during axis allocation, evaluating instance attributes are allocated to the y-axis. |
|
|
|
Instance history |
Model that visualizes the procedure or the step sequence of the respective process run. |
|
|
|
L |
|
BPMN |
EPC |
|
Last update |
The last update is the time of the last log entry for an instance (even if the technical end of the instance has not yet been reached). The last update is an instance attribute that can be allocated to an axis when an analysis is created. |
|
|
|
P |
|
BPMN |
EPC |
|
Process |
In scenarios where the PAS integration component (Bridge) and/or Designer are used, the process corresponds to an xUML service. In scenarios where BPaaS is used, the process corresponds to an app. The data generated as part of a service or an app is brought together in a data pool. This pool is labeled with the name of the service or app and forms the data basis for analyses within Process Mining. |
|
|
|
Process count |
The process count denotes the number of instances that were created in the process. The process count is an instance attribute that can be allocated to an axis when an analysis is created. |
|
|
|
Process duration |
The process duration is the time between the start and end event of a single process instance. In cases of (not yet) completed instances, the process duration consists of the time between the start event and the time the instance data was called up. The process duration is an instance attribute that can be allocated to an axis when an analysis is created. |
|
|
|
Process instance |
If a service is called up in the PAS integration component (Bridge) or in the PAS Designer or an app is run in BPaaS, a data track of this run is created. This data track is merged into the process instance. |
|
|
|
Process Mining |
Scheer PAS Process Mining is an analysis tool that can be used to analyze your process data from processes running in the different PAS components such as Designer, integration (Bridge) or BPaaS. |
|
|
|
Processing time |
The processing time indicates for how long an instance is to be found in a process step. |
|
|
|
S |
|
BPMN |
EPC |
|
Start event |
The start event marks the point of entry into the business process. The start event also defines the point in time at which a process instance is created. The start event is an instance attribute that can be allocated to an axis when an analysis is created. |
Start Event |
Start Event |
|
Step |
A process consists of various process steps that are carried out when a business process is executed. Generally, the steps are executed by a user or by an application. Step is an instance attribute that can be allocated to an axis when an analysis is created. |
Task |
Function
|
|
Step duration |
Defines the time between the start of a process step and its end. The step duration is an instance attribute that can be allocated to an axis when an analysis is created. |
|
|
|
T |
|
BPMN |
EPC |
|
Template |
A template embodies the configuration of an analysis (chart type, process, axis allocation, filter) and makes it available as a blueprint when creating an analysis. |
|
|
Comparison BPMN-Modell vs. EPC
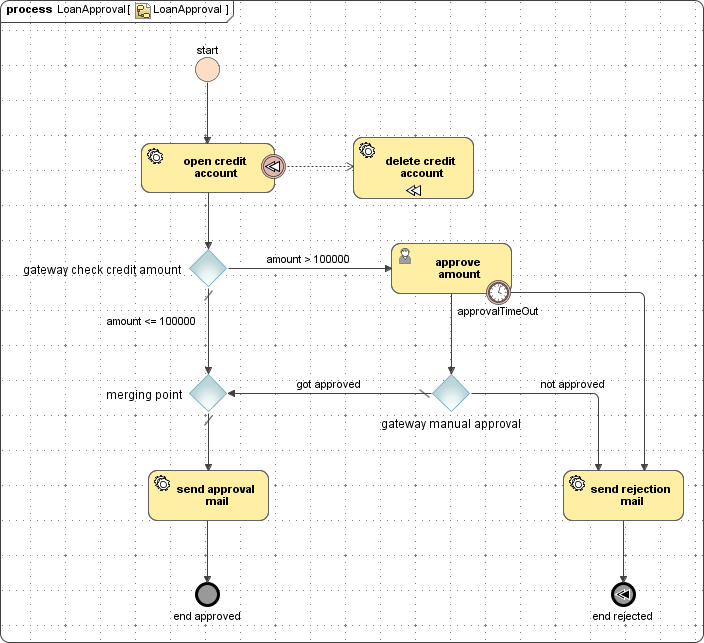
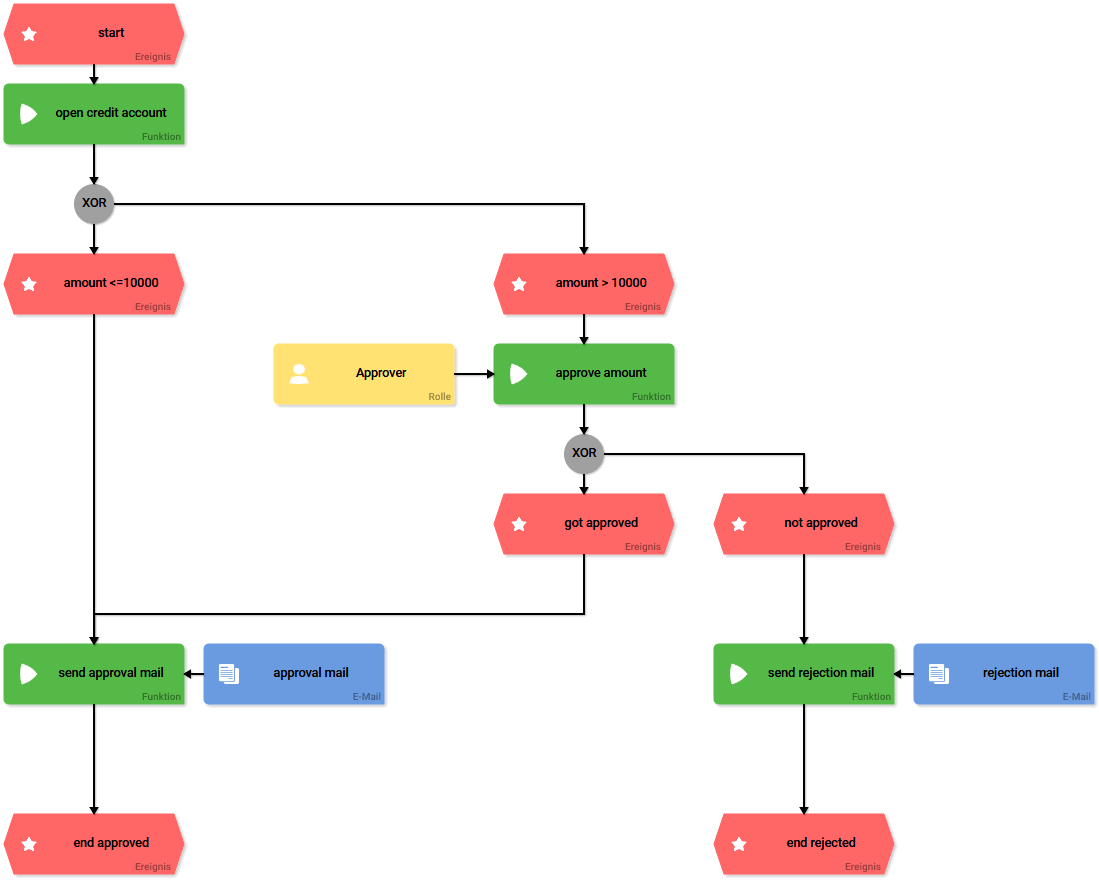
Scheer PAS Process Mining was designed so that both users of the integration componente and users of component BPaaS can use it to analyze their process data. While BPMN models are used mainly in the integration environment, the apps modelled in BPaaS are based on event-driven process chains (EPC). Both types of models are used to represent and execute business processes. The differences in representation are illustrated using the example process LoanApproval.
Example: The LoanApproval process
A credit account is created for customers who apply for a loan. With a loan amount up to 10,000, the loan is approved immediately and a confirmation email is sent. Credit requests over 10,000 must be approved manually. If the credit request is not processed within a certain time frame or is rejected by an approver, an email declining the application will be sent. On the other hand, if manual approval is given, an email confirming the application is sent. The process ends after the sending of a confirmation or rejection email.
For a better overview and the purposes of comparison, the BPMN model is displayed vertically and not - as is usual for BPMN models - in a horizontal layout.
Process LoanApproval as BPMN-Modell

Process LoanApproval as EPC

|
Element |
Image |
Description |
|
Event |
|
Events mark the start (start event) and end (end event) of the process. |
|
Task |

|
Tasks are activities that are contained in a process. In a BPMN chart, tasks are used when the process cannot be shown in more detail. Generally, tasks are executed by a user or by an application. |
|
Gateway |

|
Gateways are decision points in the process. They branch the process or bring it together again. Gateways are shown as a diamond, the type of gateway is specified by a marker. |
|
Element |
Image |
Description |
|
Event |

|
Events mark the beginning (start event) and end (end event) of the process. In BPaaS, events contain definitions of condition checks, according to which decisions have to be made. |
|
Function |

|
Functions represent the process steps that are carried out when the model is executed. In BPaaS, functions can be combined with other EPC elements that are executed by a user (forms) or automatically (email, integration). |
|
Connector |

|
Connectors are decision points in the EPC. They branch the process or bring it together again. In the EPC, however, connectors only serve as a visualization of the branching, since the event check (and thus the decision in which direction the process continues) is defined in the events. |
Related Content
Related Documentation:

