The Scheer PAS Log Analyzer is your tool to have a look at logs in the Scheer PAS platform.
The Log Analyzer uses OpenSearch as data storage and OpenSearch Dashboards to analyze the service logs. OpenSearch Dashboards is an open source analytics and visualization tool. You can search, view, and interact with data stored in OpenSearch indices. You can perform advanced data analysis and visualize your data in a variety of charts, tables, and maps in customized dashboards.
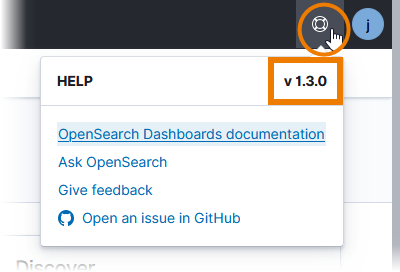
For detailed information on OpenSearch, its features and how to use them, refer to the Official OpenSearch Documentation. Please note that the official documentation may vary according to different versions of the tool. Before consulting the documentation, check your OpenSearch version.
It is displayed if you open the help menu where you can also find a direct link to the official documentation:
Accessing the Log Analyzer
You can access the Log Analyzer from several entry points in your Scheer PAS Platform:
-
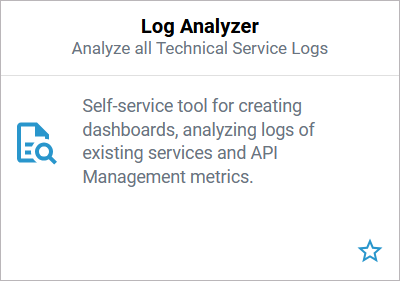
via the corresponding tile in the Scheer PAS Portal
-
directly from the Designer during service development (see https://doc.scheer-pas.com/designer/?contextKey=service-deployment-details&version=latest) to see the logs of the service you are currently working on
-
from the service details view of a selected service in the administration (see Working With the Administration)
Access via Portal
You can access the Log Analyzer via the corresponding tile in the Scheer PAS Portal:
Only users with profile kibana_user are able to see the tile in the portal.
When you click the Log Analyzer tile, the tool opens within the portal:
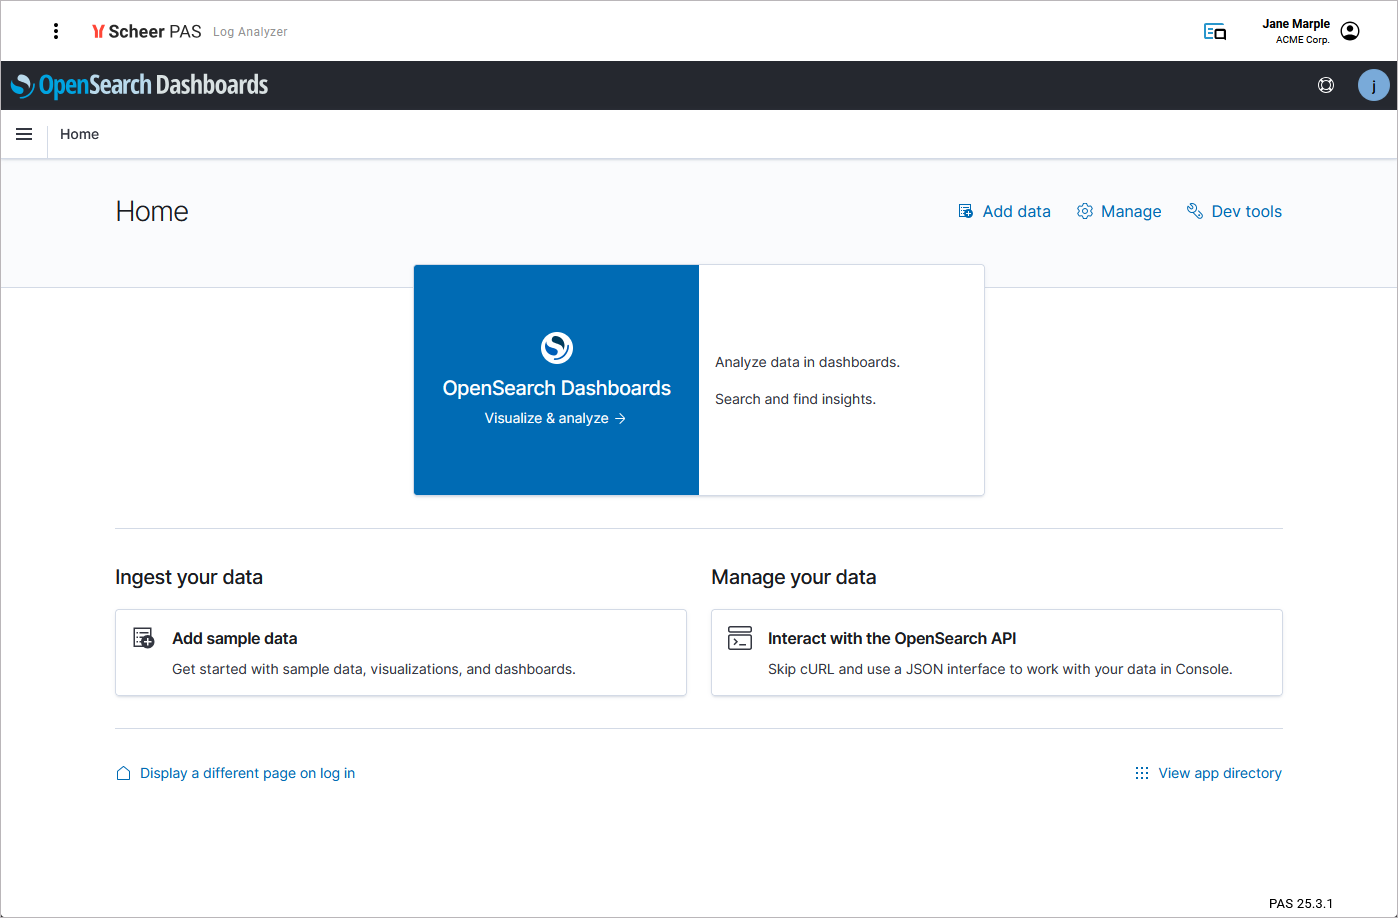
You can also open the Log Analyzer in a separate browser tab. To do so, use option Open in new browser tab in the lower right corner of the tile.
Access via Designer
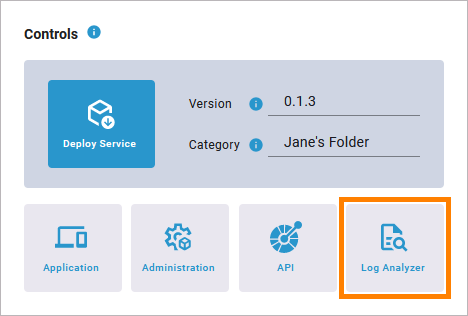
Click the Log Analyzer button to access the Log Analyzer from the service details in the Designer:
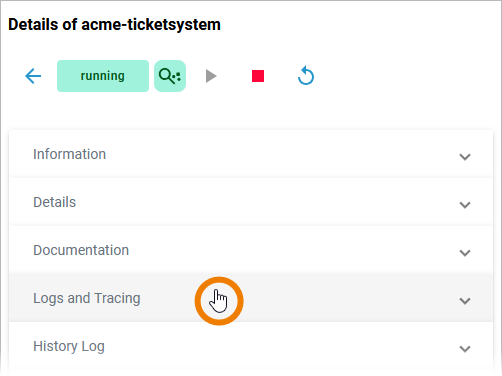
Access via Service Details
Click Logs and Tracing in the details of a service in the Administration as described on
Log Analyzer Options
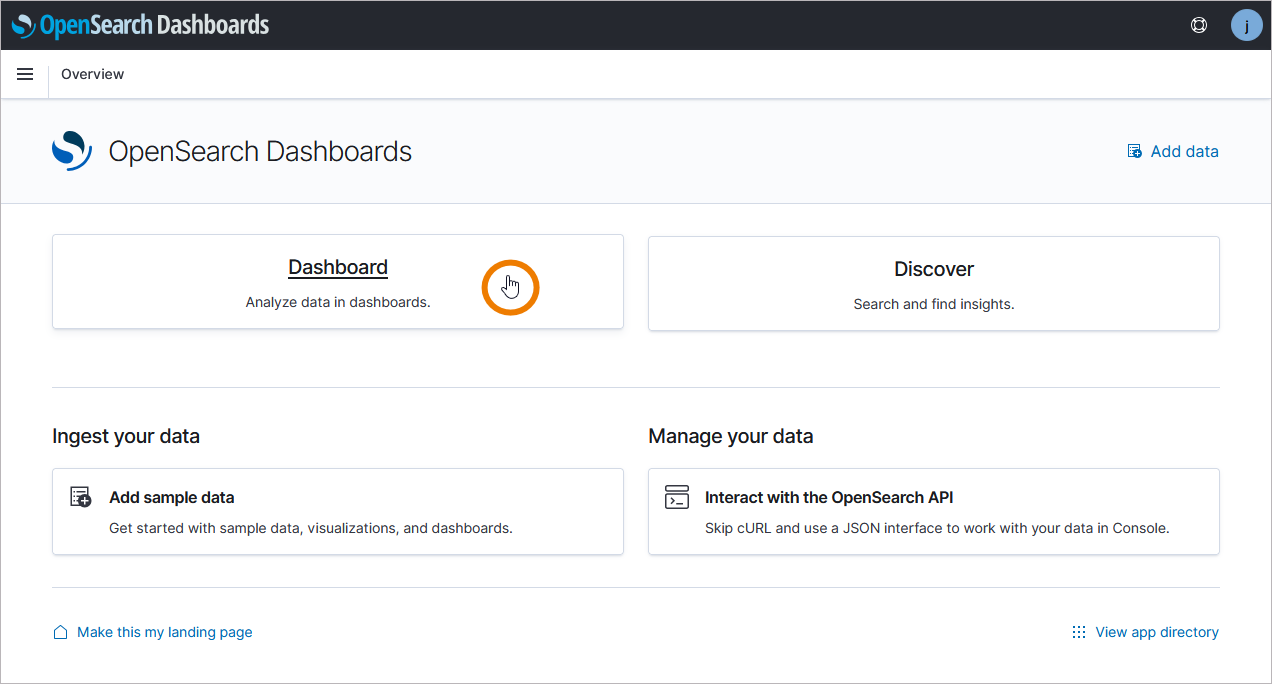
In the log analyzer, you have two options:
-
Analyze the available data in a preconfigured dashboard or custom dashboard:
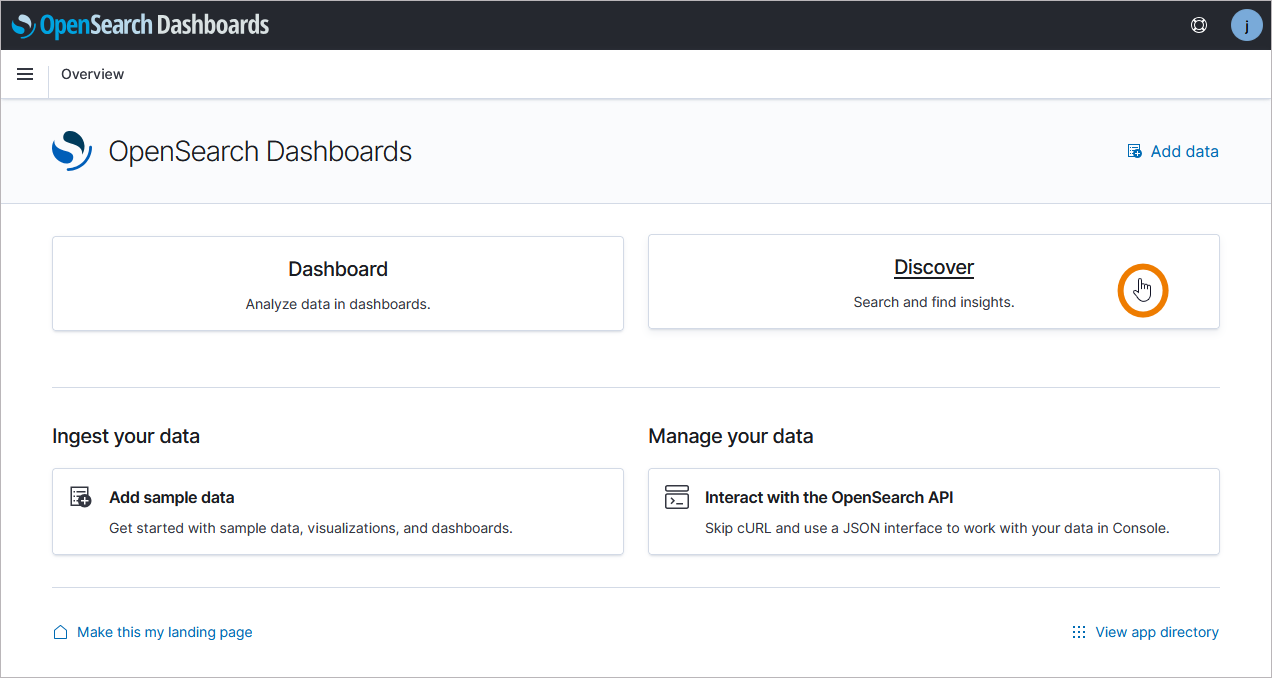
-
Inspect the service logs using one of the predefined indexes (or create your own index):
You can also access both options via the main menu:
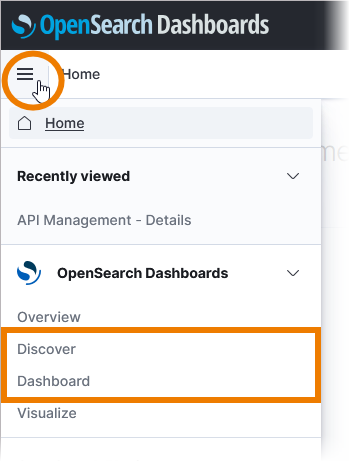
Refer to Using Dashboards for details on dashboard usage and to Log Analyzer Indexes for more information about indexes.
The retention time for logs in the Log Analyzer is 30 days.
Footnotes
Differences between Docker and Kubernetes
Customers can run Scheer PAS on a Docker or a Kubernetes setup.
If the behavior of Kubernetes and Docker differs, we highlight the text in different colors to clarify the differences:
-
Kubernetes-related text is highlighted in green.
-
Docker-related text is highlighted in blue.
Related Content
Related Documentation: