Once an API is published and is being consumed at runtime, metrics information about that usage is recorded in the Scheer PAS Log Analyzer (based on OpenSearch). For each request, various pieces of information is stored, including but not necessarily limited to the following:
-
Request start and end times
-
API start and end times
-
Resource path
-
Response type (success, failure, error)
-
API info (org id, id, version)
-
Client app info (org id, id, version)
For APIs and clients, you can access these metrics directly in API Management, or you can analyze the data using the Log Analyzer. API Management provides some basic, predefined metrics, the Log Analyzer is a reporting tool that lets you define your own reports based on OpenSearch data.
The dashboard displayed in the Metrics tab of APIs and clients is an embedded functionality of OpenSearch. For a detailed documentation of its functionalities, visit the official OpenSearch documentation.
Metrics in the API Management UI
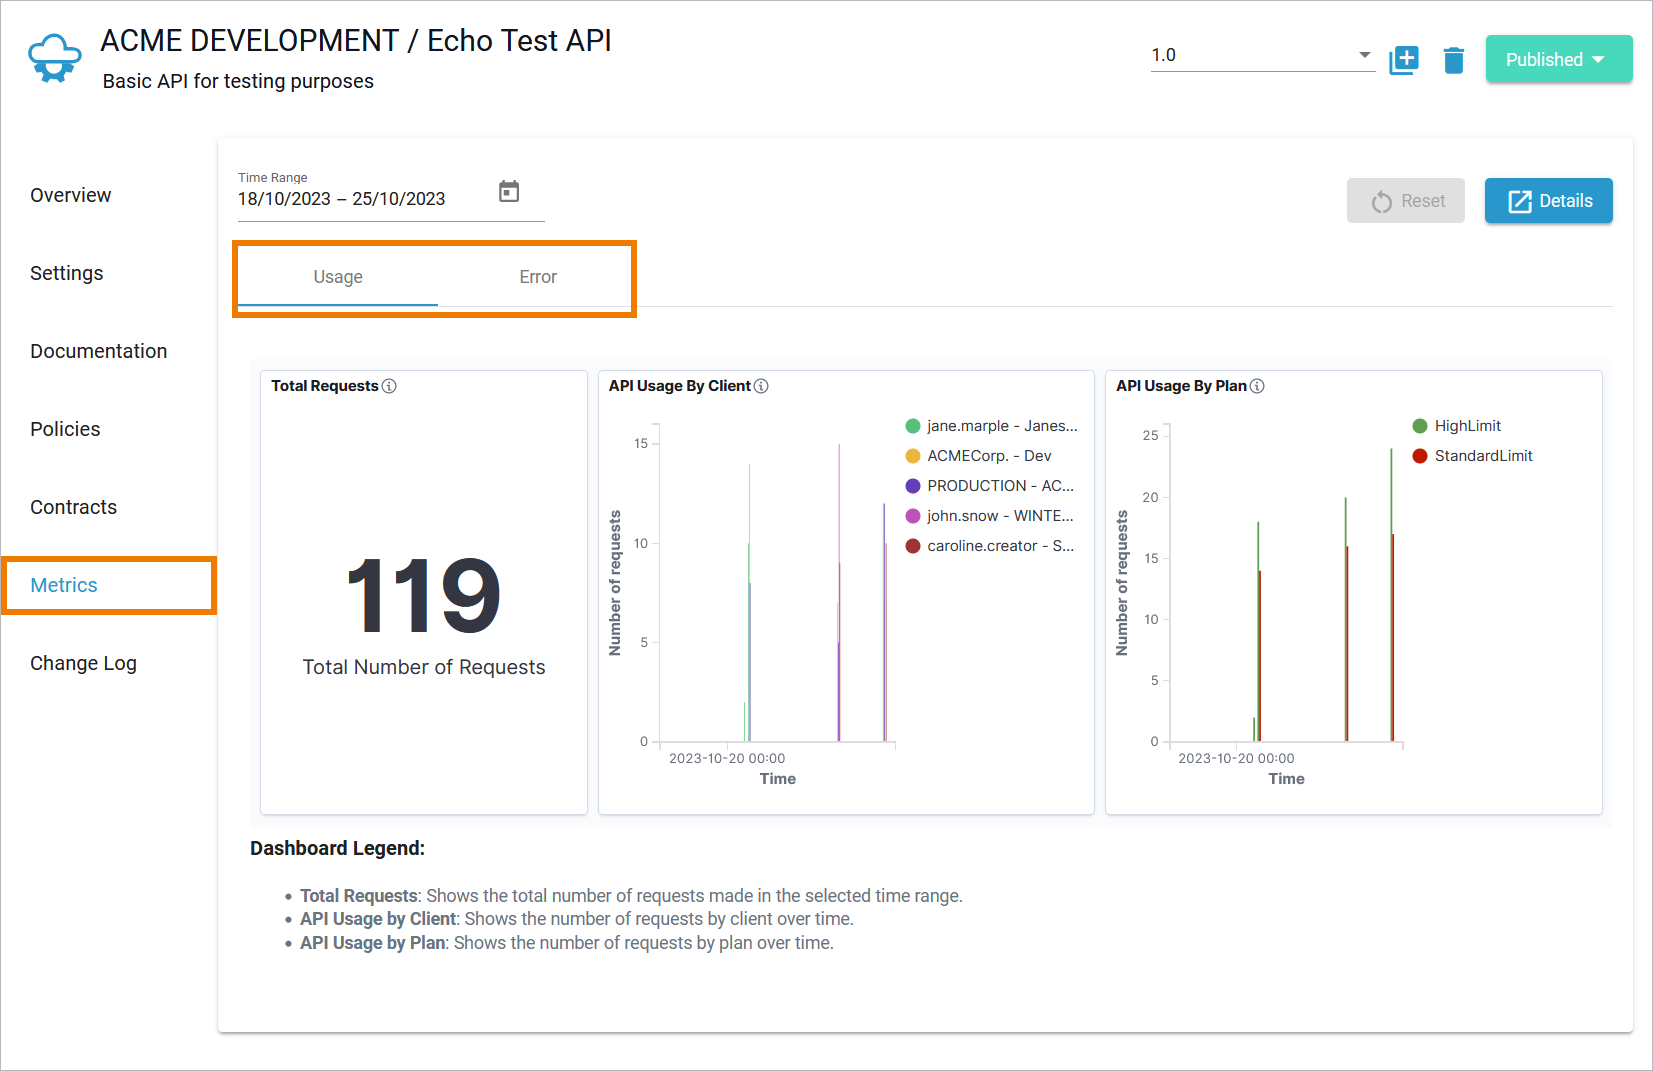
In API Management, some basic metrics based on API and client data are available. The preconfigured metrics are shown as a dashboard within tab Metrics in the API Settings and Client Settings. The dashboard contains two tabs: Usage and Error. While tab Usage contains information about the usage of an API or a client, tab Error displays details about error and failure messages.
|
|
Definition |
|---|---|
|
Error |
|
|
Failure |
|
API Metrics
|
API Usage |
Total Requests |
Shows the total number of requests made in the selected time range. |
|---|---|---|
|
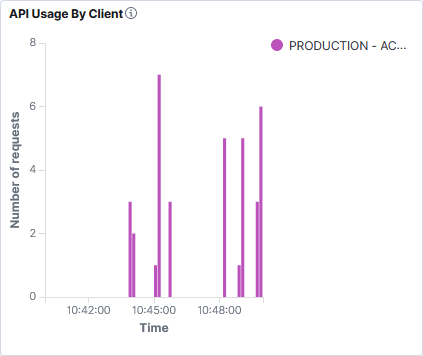
API Usage by Client |
Shows the number of requests by client over time. |
|
|
API Usage by Plan |
Shows the number of requests by plan over time. |
|
|
API Error |
Total Requests |
Shows the total number of requests made in the selected time range. |
|
Error Message |
Shows the error rate of all requests. |
|
|
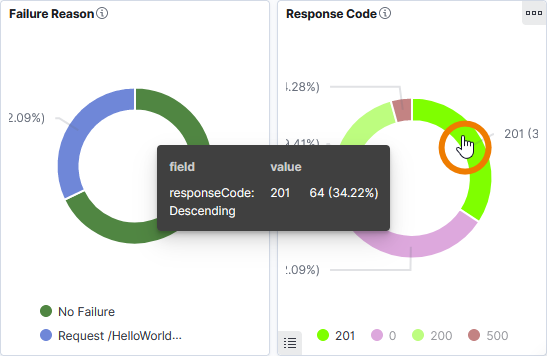
Failure Reason |
Shows the distribution of the failure reason over all requests. |
|
|
Response Code |
Shows the distribution of the response code over all requests. |
Client Metrics
|
Client Usage |
Total Requests |
Shows the total number of requests made in the selected time range. |
|---|---|---|
|
Client Usage by API |
Shows the number of requests by API over time. |
|
|
Client Usage by Plan |
Shows the number of requests by plan over time. |
|
|
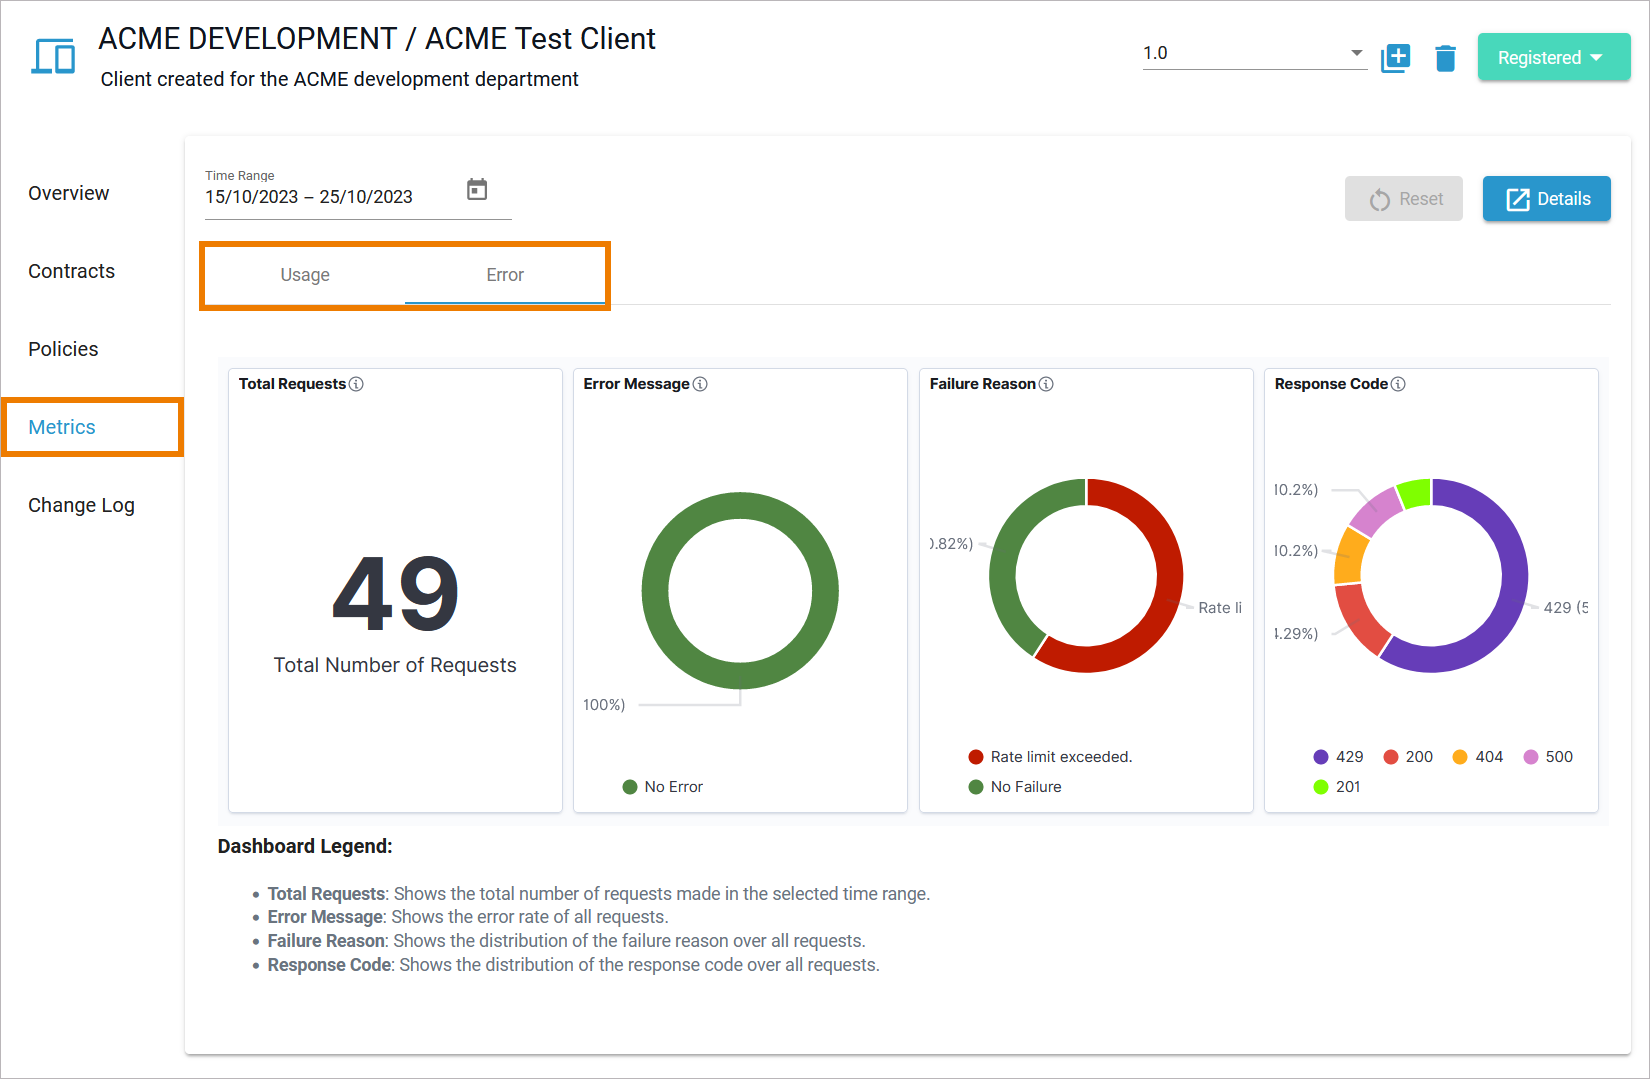
Client Error |
Total Requests |
Shows the total number of requests made in the selected time range. |
|
Error Message |
Shows the error rate of all requests. |
|
|
Failure Reason |
Shows the distribution of the failure reason over all requests. |
|
|
Response Code |
Shows the distribution of the response code over all requests. |
Working With Metrics
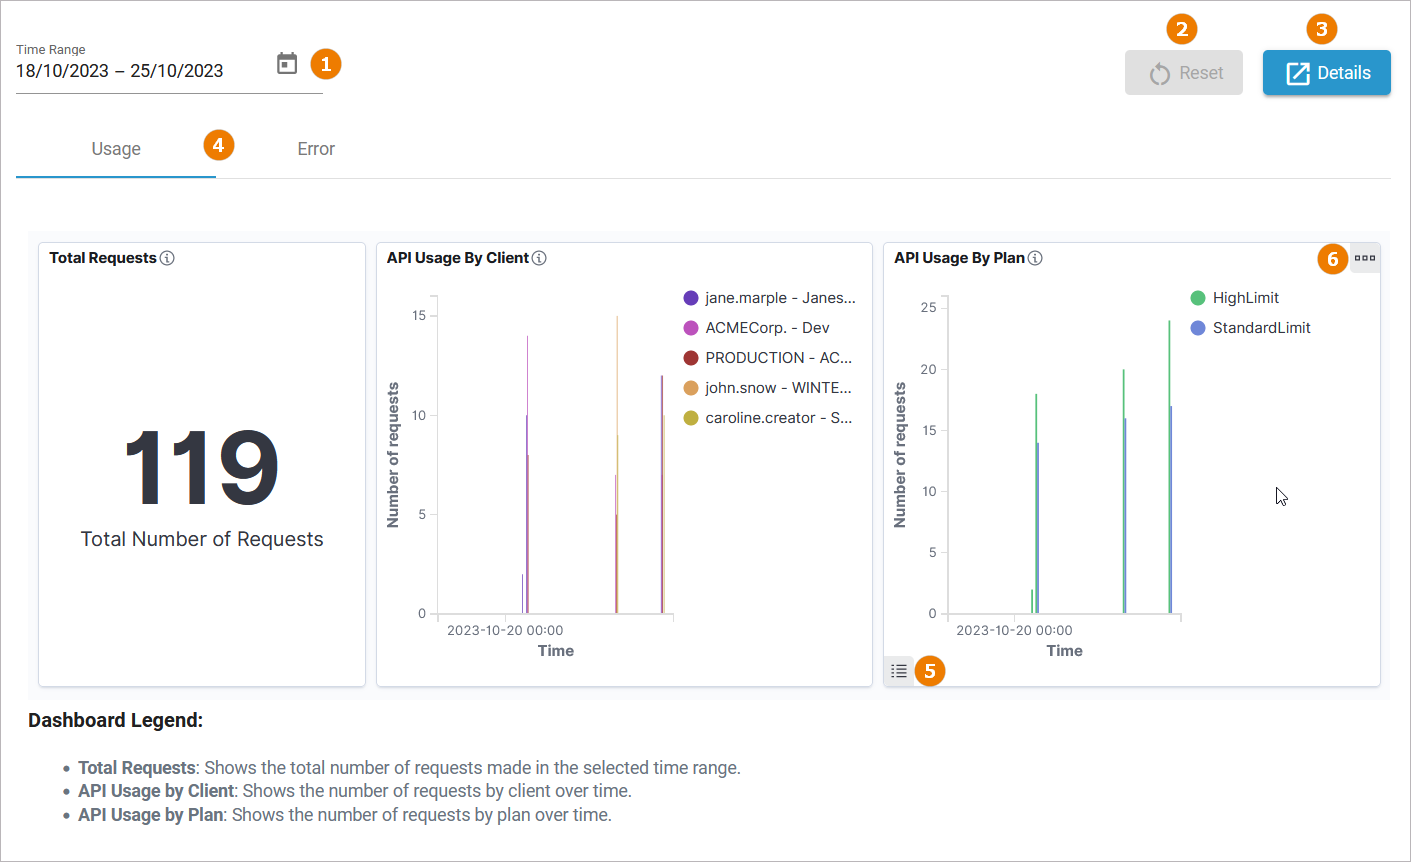
The dashboards offer various functionality to inspect the data:
|
UI Element |
Name |
Description |
|---|---|---|
|
(1) |
Time Range |
Specify here the period for which you want to view data. You can enter the dates manually, or use the date picker to define the time range. |
|
(2) |
Reset |
Click Reset to reset all dashboard filters. |
|
(3) |
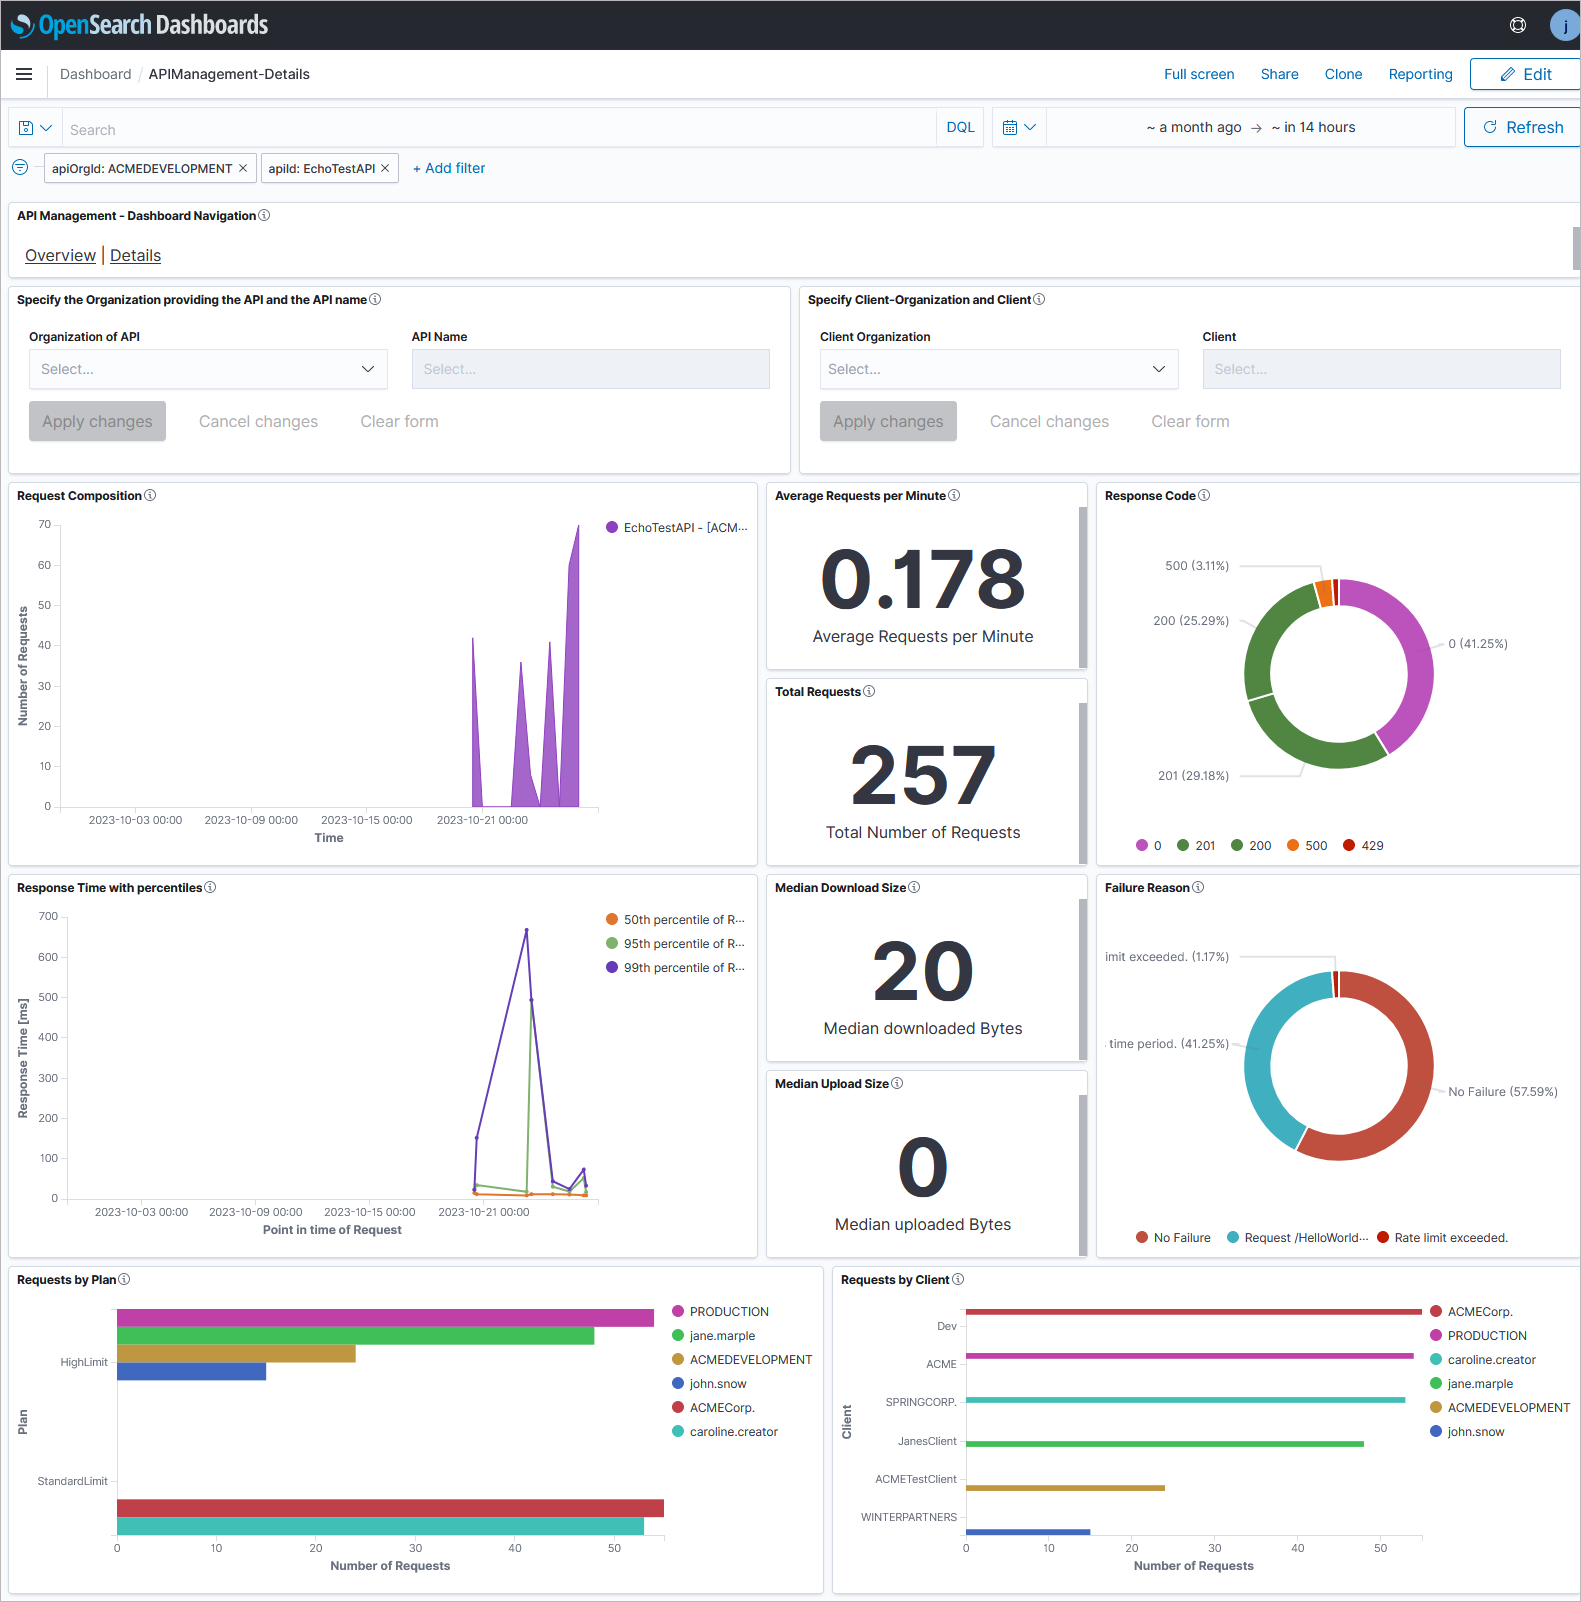
Details |
Click Details to open the preconfigured dashboard API Management - Details in the Log Analzyer. |
|
(4) |
Dashboard Content |
Select tab Usage to see the usage metrics and Error to inspect the error metrics. |
|
(5) |
Legend |
Hover over the lower left edge to display Toggle legend. Click the list button to show / hide the legend within the diagram. By default, the legend is shown. |
|
(6) |
Options |
Hover over the top right edge to display the Options. Click the menu button to access a menu with the following options:
|
Additional Functionality
Hover over the diagram parts to display additional information:
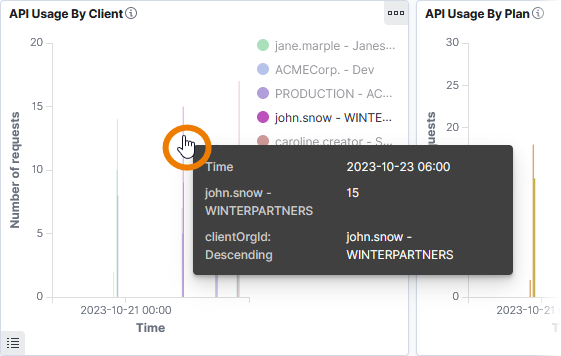
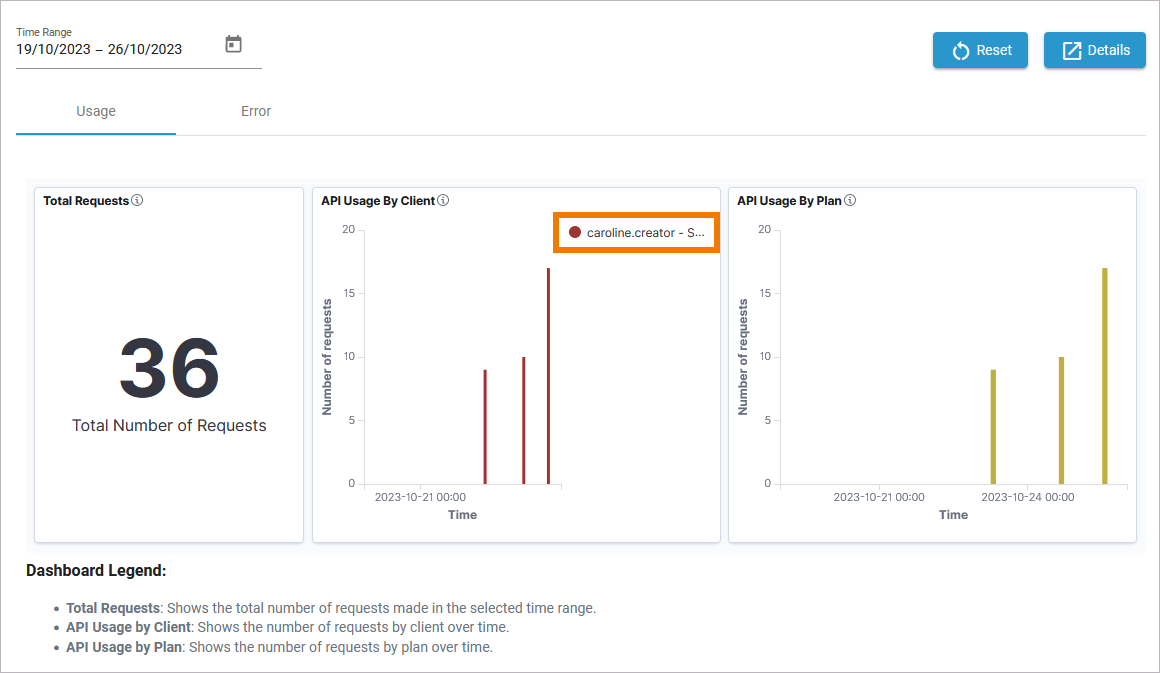
You can also click the content to select some filters...
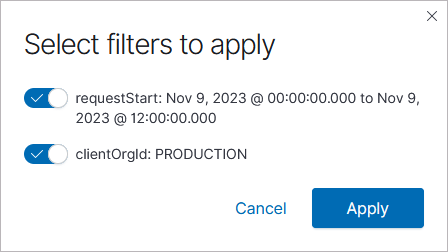
...to display the data in more detail:
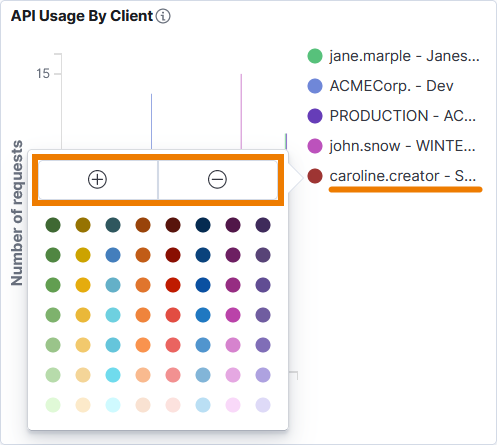
You can change the color of the displayed legend. Click on a legend entry to open the color picker:
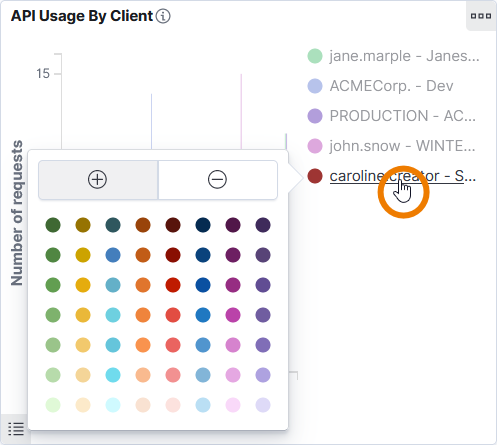
Within the color picker, you have also two additional filters:
-
Click Plus to filter for the value.
-
Click Minus to filter out the value.
The value filter is applied to all diagrams in the dashboard:
Metric Reports Using the Log Analyzer
The Log Analyzer is an analytics and visualization tool designed to work with OpenSearch. With the Log Analyzer you can search, view, and interact with data stored in OpenSearch indices. You can perform advanced data analysis and visualize your data in a variety of charts, tables, and maps. The Scheer PAS Log Analyzer already contains some default dashboards for API Management users. For more information about the log analyzer, refer to Analyzing Platform Logs in the Administration Guide.
Related Content
Related Pages:
Related Documentation: