The development process in the Designer has been optimized: Developers always work in a test environment where they get constant feedback on their changes and are able to test them directly against the service preview - without having to deploy the service.
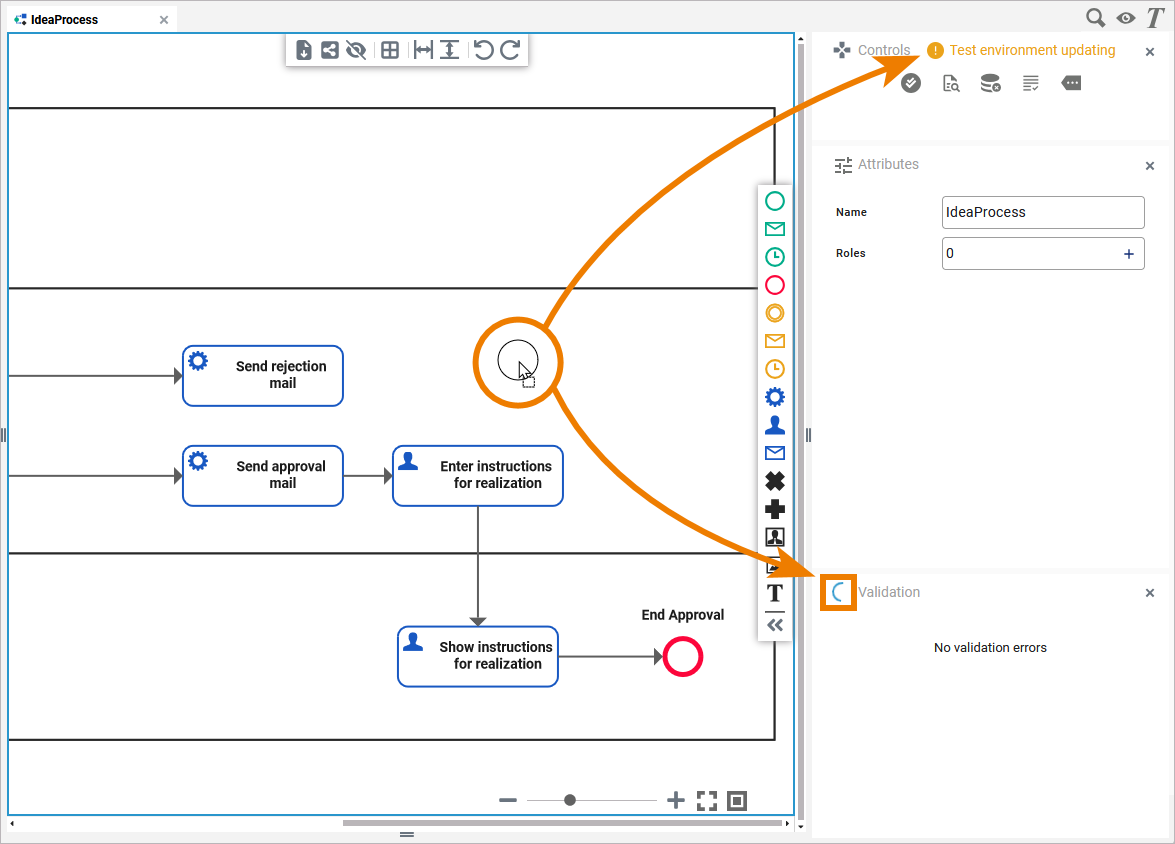
When you create a new service or open an existing one, you are automatically working in the test environment. Its status is displayed in the Controls panel:

The test environment is automatically started and stopped:
-
It is started...
-
when you open a service and start working on it.
-
when you select option Open test application.
-
when you trigger a manual validation via option Start validation.
-
-
It is stopped...
-
when you have not worked on your service for a certain amount of time. Default setting is 2 hours.
-
when the corresponding project is deleted.
-
|
Status Message |
Description |
|---|---|

|
The test environment has not yet been started or has expired. |

|
The Designer is preparing the test environment. |

|
The test environment is started. You can access the application preview. |
Using the Test Environment
The test environment is initialized automatically when you start working on a service. As soon as you make changes in the Designer, the test environment is updated to reflect your changes. In addition, your actions are constantly compiled and validated. Compilation errors are displayed in the validation panel. Check the panel for errors and warnings to resolve any problems that occur in your service. Refer to Validation Panel and Using the Validation for details.
You can disable the auto validation, refer to Managing the Service Details for further information.
The Controls panel contains options to support you during the development process:

|
Icon |
Description |
|---|---|
|
|
Use this option to trigger the validation manually. |
|
|
Use this option to open the Log Analyzer and access the logs. You have the choice between service and application logs.
Refer to Analyzing Platform Logs in the Administration Guide for further information about the Log Analyzer. |
|
|
Use this option to clear the Compiler cache. Clearing the cache is helpful if the validation panel shows errors you cannot solve. Using this option reinitializes the test environment. |
|
|
Use this option to open a preview of your service for testing. |
|
|
Use this option to open the additional menu of the controls panel which gives you access to further options (refer to Controls Panel for details). |
Using the Service Preview
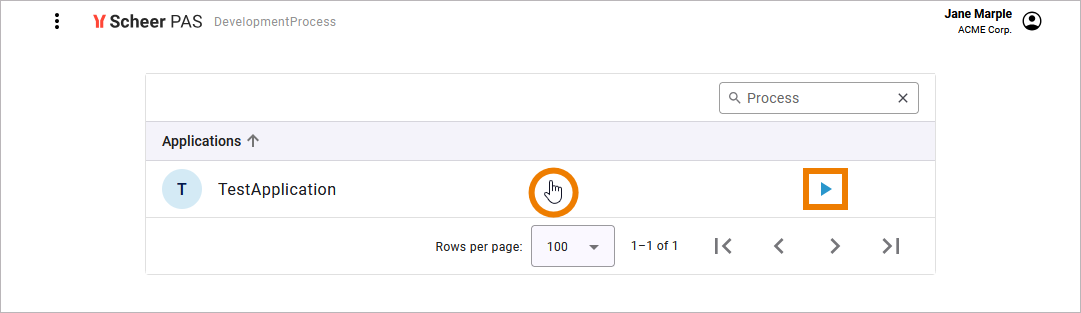
Accessing the test service is possible without deployment. Open the service preview via the controls panel and the service start page will open in a new tab.
All processes that are available in your service are displayed. Click on a process row to open its instance list, use the Start button to create a new instance:
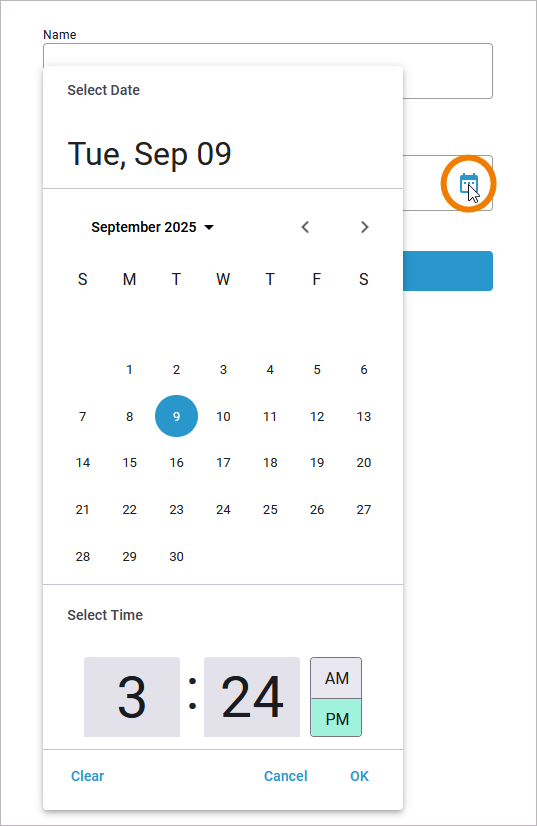
The preview is fully operational. Use it to check functionality, layout and design of your process and its forms: