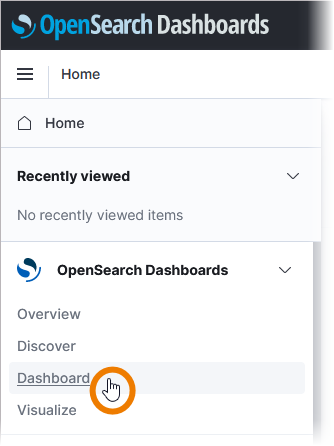
The log analyzer offers some default dashboards and the possibility to create your own dashboards. You can add a variety of different panels to inspect and visualize your data, for example area charts, bar and line charts, tree and heat maps, metrics, data tables and many more. To access the dashboards, choose option Dashboard on the log analyzer start page or menu option Dashboard in the menu sidebar:
You get an overview of all pre-configured PAS dashboards. Click on a dashboard to open it:
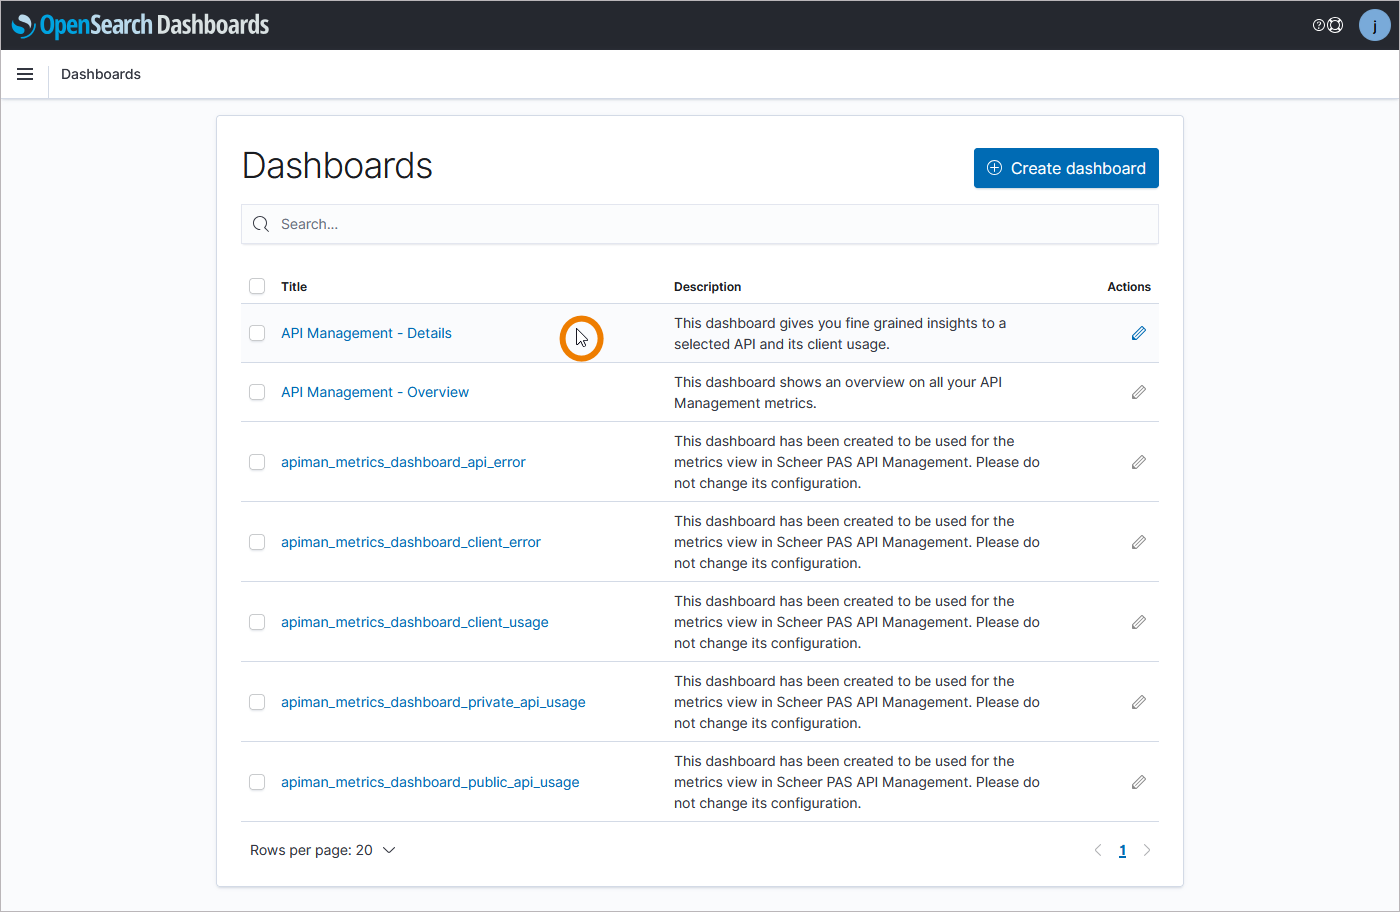
Refer to the API Management Guide for further information about the API Management default dashboards:
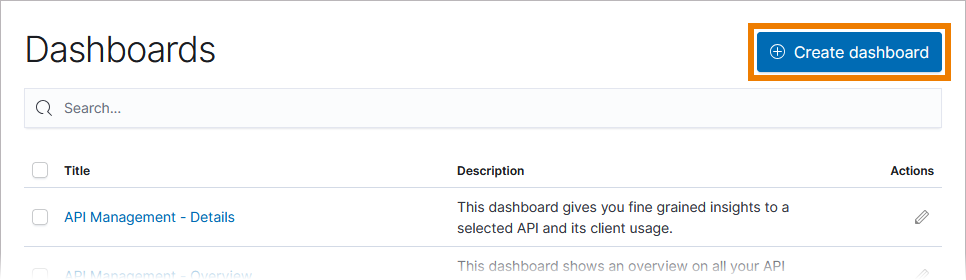
If you want to add your own dashboards, use the Create dashboard button on the dashboard start page:
Refer to chapter OpenSearch Dashboards in the Official OpenSearch Documentation for detailed information how to create a dashboard.
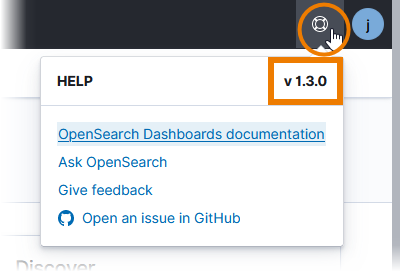
For detailed information on OpenSearch, its features and how to use them, refer to the Official OpenSearch Documentation. Please note that the official documentation may vary according to different versions of the tool. Before consulting the documentation, check your OpenSearch version.
It is displayed if you open the help menu where you can also find a direct link to the official documentation:
Related Content
Related Documentation: