See below the HelloWorldUI example in Firefox with the debug window open at the bottom.
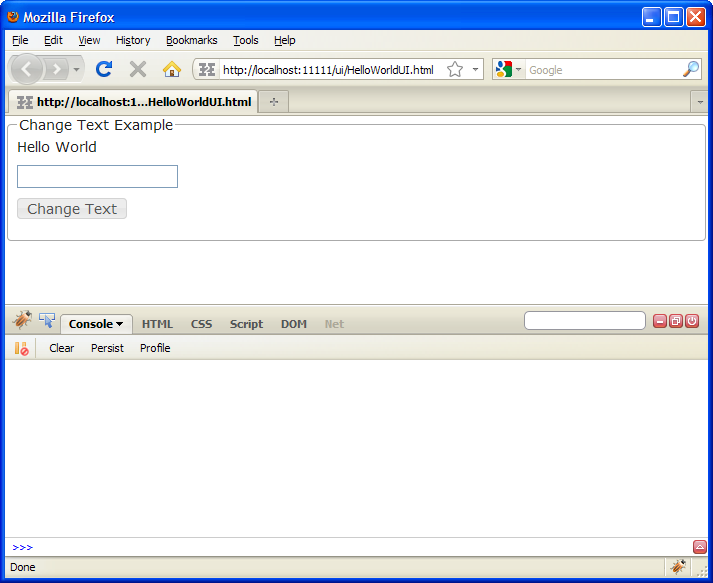
To open the debugger, press F12.
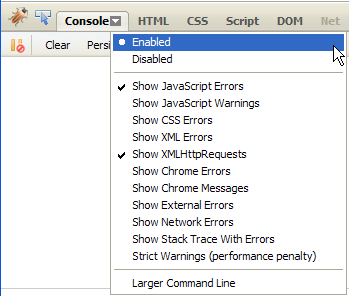
To be able to debug xUML UI applications there are some important settings that need to be set in the debugger:
|
|
Within the Console make sure that the following items are selected:
|
To see how the console works and how the information can be viewed change the text in the text field and apply the change by clicking on the YES button in the application.
You will see following entries:
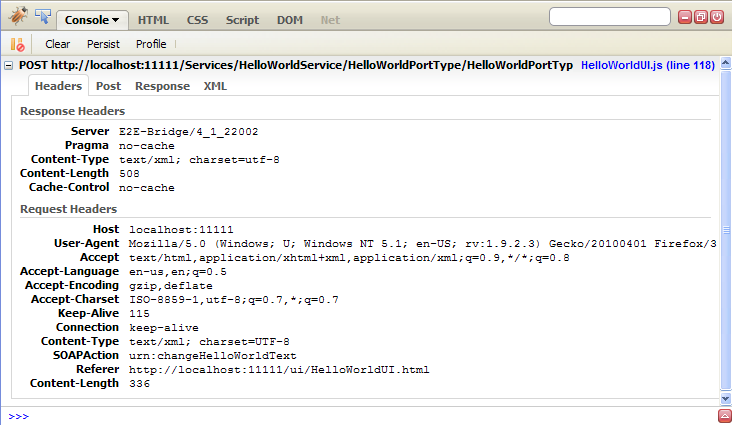
The entry within the console represents the AJAX request the xUML UI sent to the E2E SOAP service. The first tab Headers explains some technical HTTP request parameters that were used for doing this HTTP POST request.
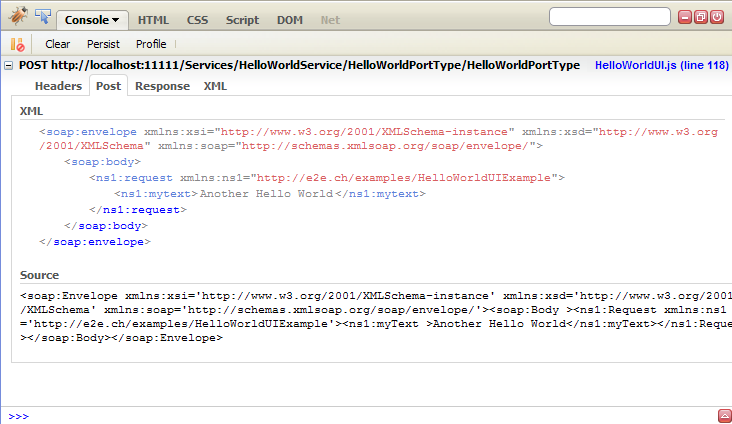
The second tab Post shows the XML structure which was posted to the service. The request object can be seen clearly in the XML structure holding the text input ("Another Hello World") from the user interface within the xml element mytext.
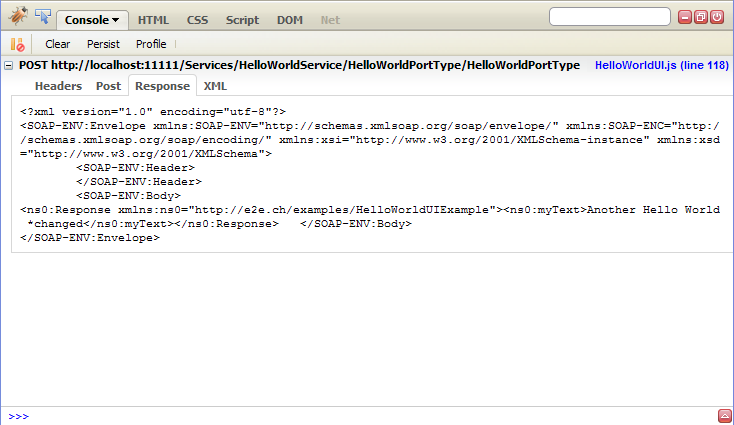
The third tab Response shows the content of the response object. It is the same text from the text input field but now, changed by through the SOAP service has the additional text *changed appended to it. This XML response is used by the AJAX and jQuery framework to change the HelloWorld label field.
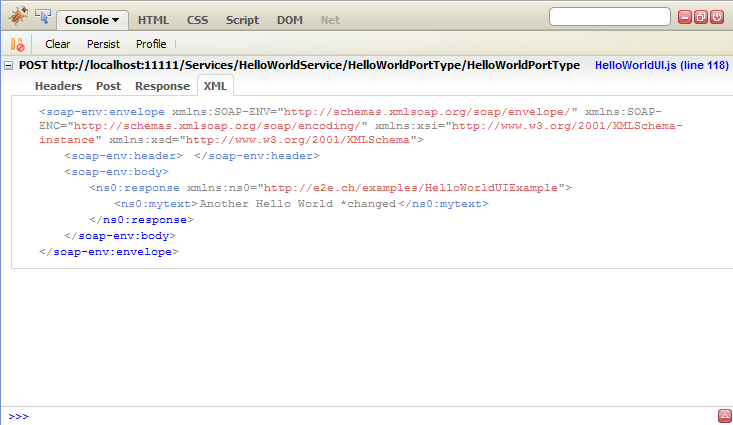
The forth and last tab XML holds the raw SOAP response version of the services response.

