When having started a service in debug mode (e.g. by selecting Debug from the context menu of the deployment or by clicking ![]()
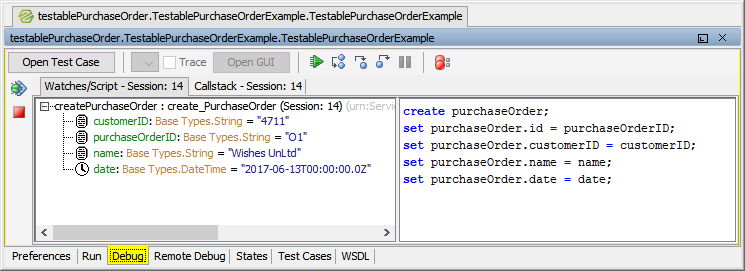
For a detailed description of how to debug a service refer to The Interactive Debugger.
When having started a service in debug mode (e.g. by selecting Debug from the context menu of the deployment or by clicking ![]()
For a detailed description of how to debug a service refer to The Interactive Debugger.