Understanding all relevant data and the relationships between them is important to get to the root of incidents as quickly as possible and identify the actual source of unexpected system behavior. Use the Scheer PAS Resource Monitor to visualize and understand your container activities. Only users with profile resource_monitor_user or pas_user are able to use the application.
The resource monitor uses Grafana. Grafana is an open source analytics and visualization tool. Scheer PAS uses it to provide you with a preconfigured dashboard for monitoring system capacity.
For detailed information on Grafana, its features and how to use them, refer to the Official Grafana Documentation.
What is the Resource Monitor used for?
Use the Resource Monitor in addition to the Log Analyzer and the PAS Administration to analyze faulty services and find solutions for problematic behavior.
The retention period for data available in the resource monitor is currently 15 days.
Examples:
-
A service crashes periodically.
-
A service always causes a very high load at certain times.
Use the Resource Monitor to find out which services are affected. It also shows you the load a service causes and the memory usage of the service. You can check whether defined limits are repeatedly exceeded - and react accordingly.
Use the Log Analyzer to check whether certain error messages in the service logs correlate with periods of high load or memory usage.
Refer to Analyzing Logs for details.
Use the service details in the PAS Administration to adapt the memory limit of a service.
Depending on your setup, refer to Docker: Adapting the Configuration of Containerized xUML Services or
Kubernetes: Adapting the Configuration of Containerized xUML Services.
Accessing the Resource Monitor
You can access the resource monitor via the corresponding tile in the Scheer PAS Portal:
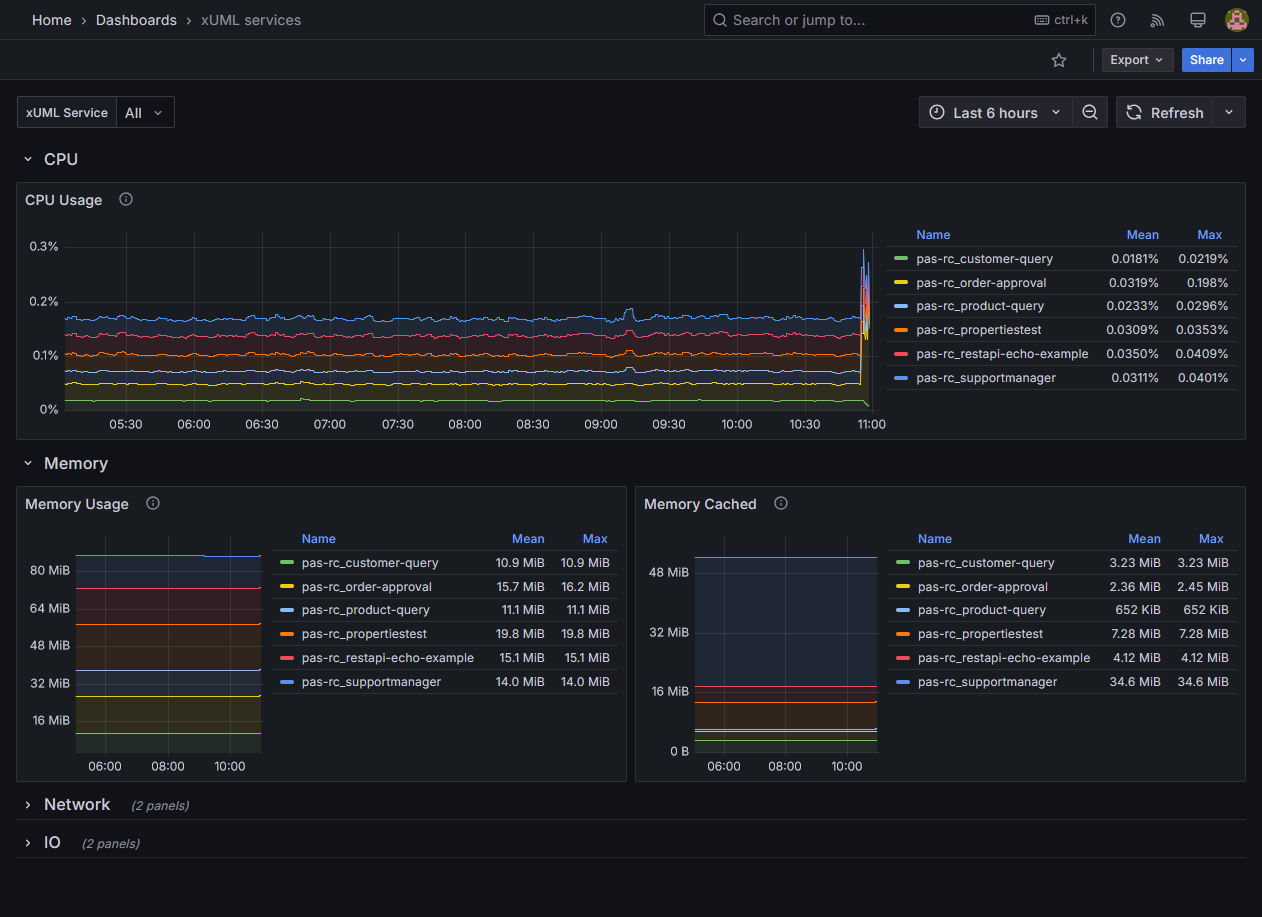
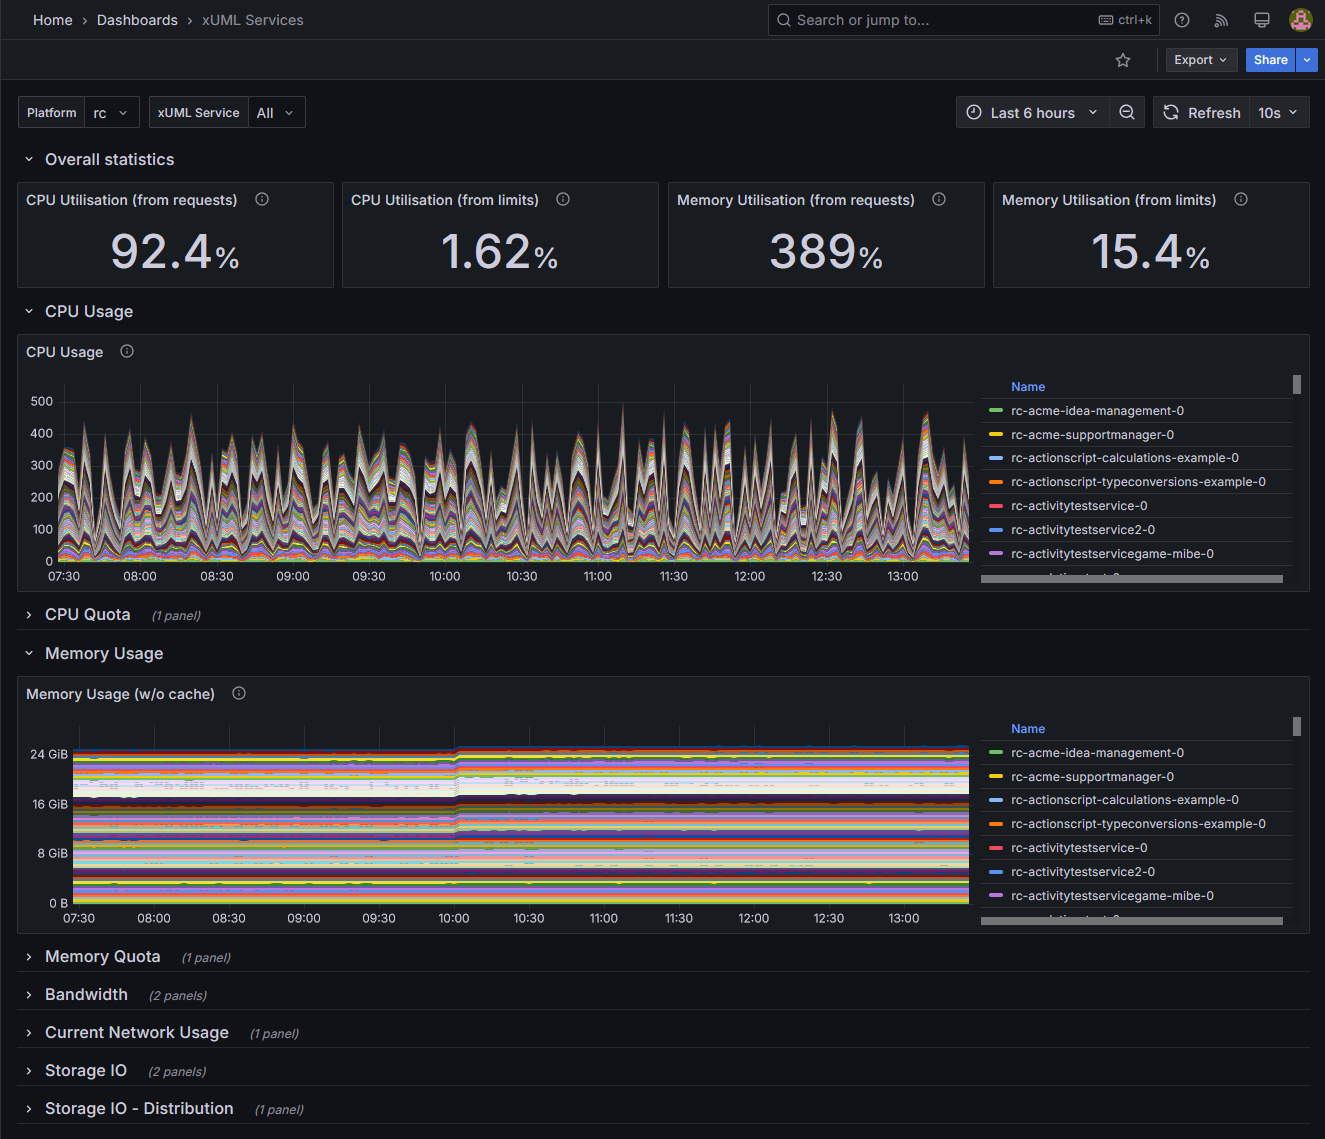
The contents of the resource monitor dashboards differ depending on whether you are using a Docker or a Kubernetes setup.
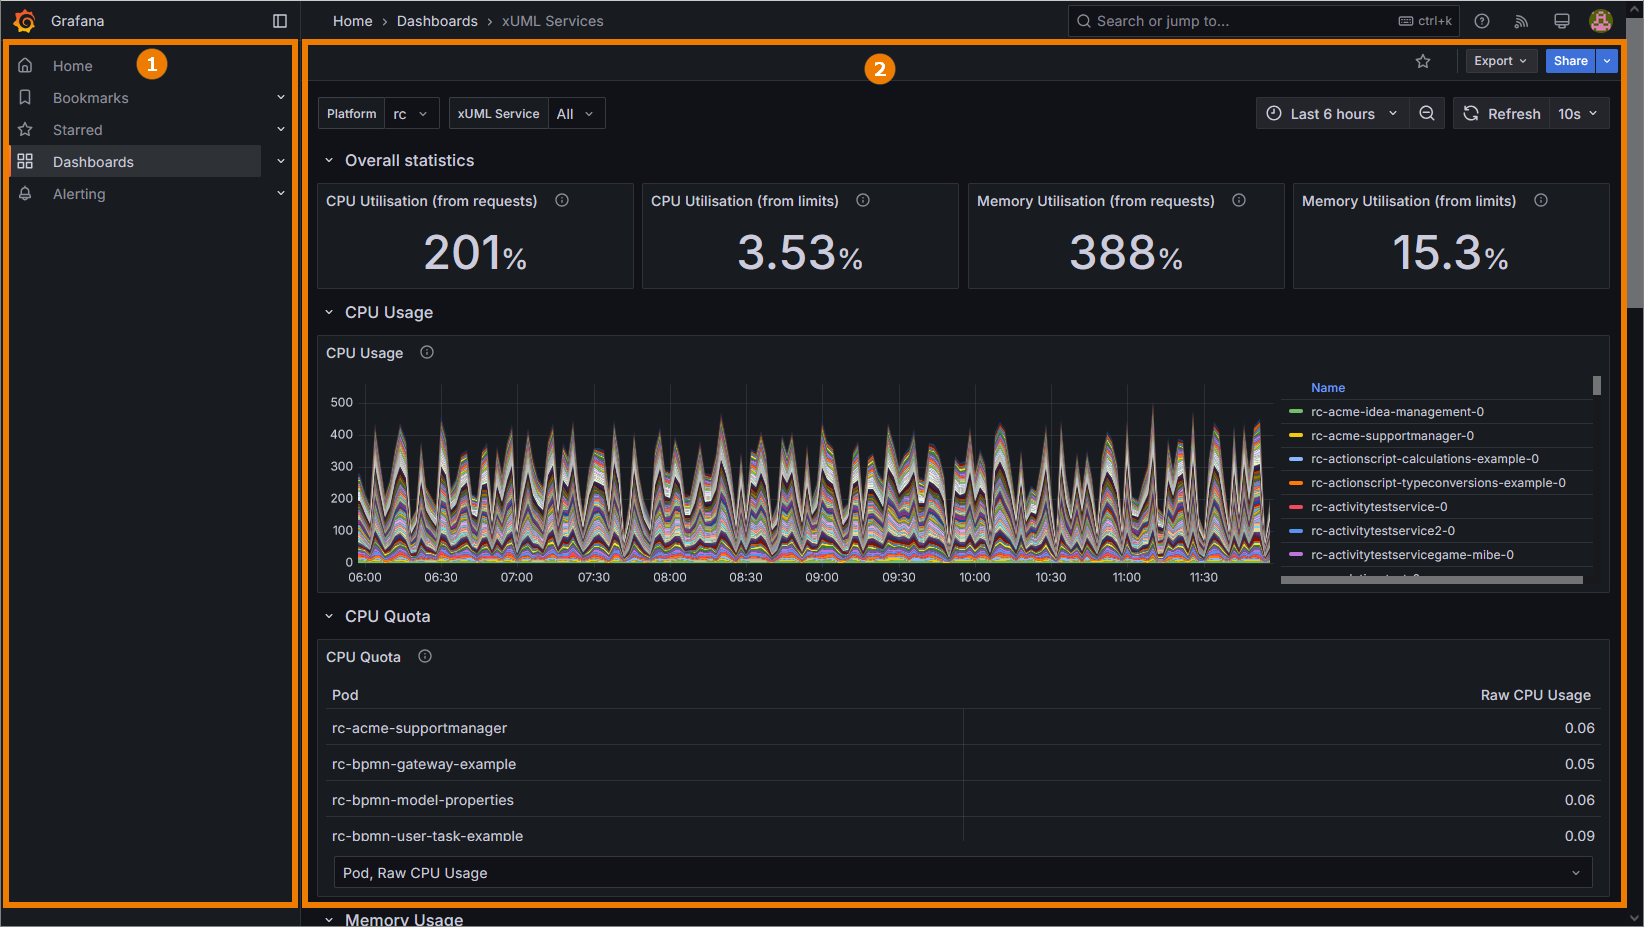
If you click on the resource monitor tile, the application will open in a new browser tab. The resource monitor start page consists of two sections:
|
(1) |
Sidebar: From the sidebar on the left-hand side you can switch between different menu options such as managing bookmarks and favorites. In the first version of the resource monitor, most of the options have no function as you cannot create new dashboards or alerts. |
|---|---|
|
(2) |
Dashboard: The standard dashboard for the metrics of your xUML services is displayed on the right-hand side. In the first version of the resource monitor, we deliver the standard xUML services dashboard that allows you to inspect the data of all your xUML services. The standard dashboard is read-only. You can use it to inspect the metrics for your xUML services, but you cannot create new dashboards. |
Depending on the setup of your Scheer PAS system, the content of the xUML services dashboard contains different information:
For further information on how to use the xUML services dashboard, refer to Working With the Resource Monitor.
Related Content
Related Documentation: