The Log Analyzer uses OpenSearch as data storage and OpenSearch Dashboards to analyze the service logs. OpenSearch Dashboards is an open source analytics and visualization tool. You can search, view, and interact with data stored in OpenSearch indices. You can perform advanced data analysis and visualize your data in a variety of charts, tables, and maps in customized dashboards.
For detailed information on OpenSearch, its features and how to use them, refer to the Official OpenSearch Documentation.
The log analyzer needs to knows which indexes contain the data you want to analyze. So you need at least one index pattern to make sure that data is available.
Preconfigured Index Patterns
When installing Scheer PAS, several index patterns are automatically created. These differ depending on the setup.
Docker Index Patterns
The following table lists the index patterns that are preconfigured in Docker setups.
|
Index Pattern |
Description |
|---|---|
|
apiman_metrics* |
Required to visualize API Management metrics (see API Management Guide > Metrics). |
|
fl* |
Index for logs from the PAS integration component (Bridge), API Management and legacy pas-services.
|
|
pas* |
Index where PAS services store their log entries.
|
|
xuml* |
Index for logs from containerized xUML services (deployed via Scheer PAS Designer or deployment wizard).
The data of an xUML service is logged only after a service deployment. |
Kubernetes Index Patterns
The following table lists the index patterns that are preconfigured in Kubernetes setups.
|
Index Pattern |
Description |
|---|---|
|
apiman_metrics* |
Required to visualize API Management metrics (see API Management Guide > Metrics). |
|
logs* |
Index for logs from all components of your PAS installation.
|
Creating an Index
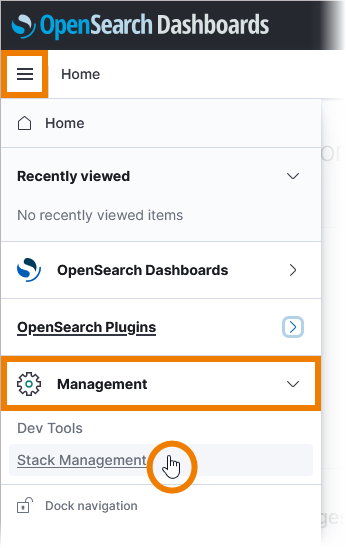
If your log analyzer is empty and does not contain an index pattern, it asks you to create one. You need to do this only once after the first login, then all permitted users can view the logs. To create an index pattern, open the log analyzer and close the pop-up Select your tenant. Then open the menu, scroll down to section Management and select Stack Management:
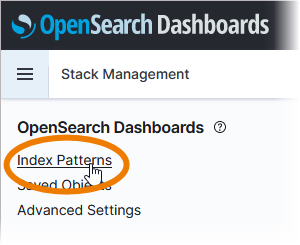
In the Stack Management view, select menu option Index Patterns:
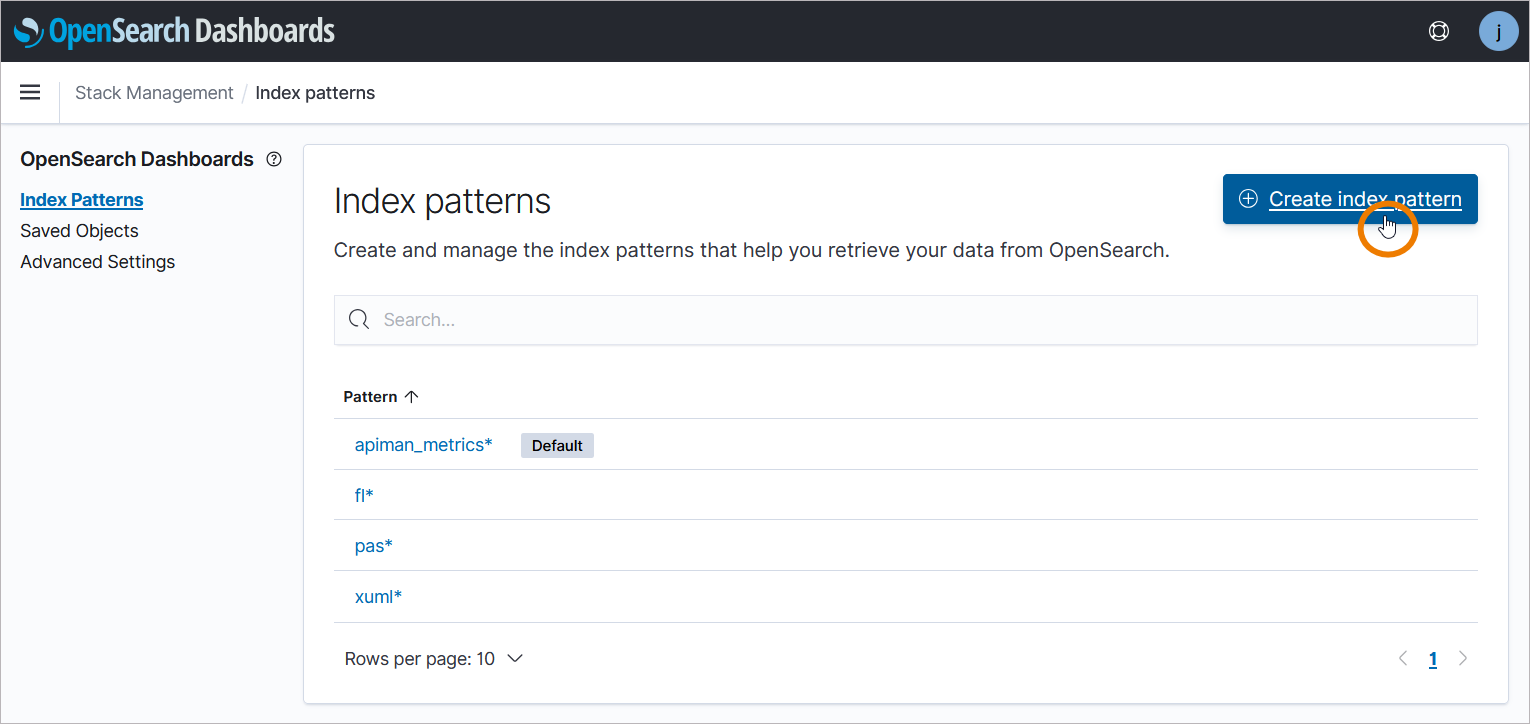
You will see all pre-configured indices and the button Create index pattern:
Now you can define your index pattern. Enter an index pattern name in the search field. The Log Analyzer will display the matching indices. In the next step, select @timestamp as the primary time field, the click Create index pattern.
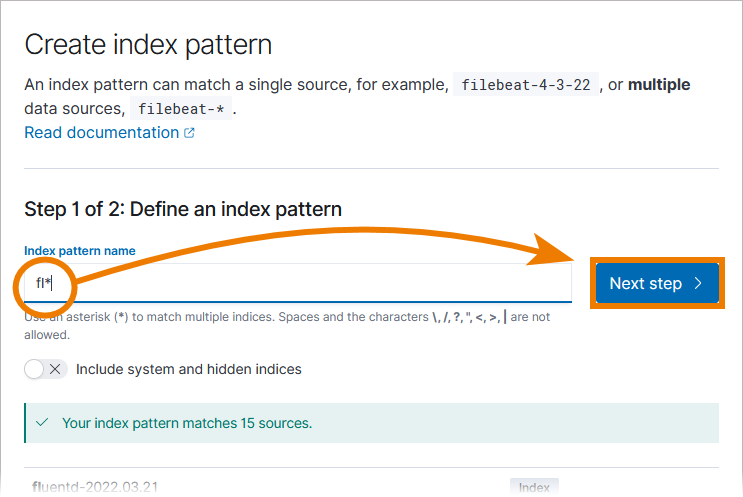
Example: Creating the fluentd Index
In Docker setups, PAS logs are stored by date in a rolling index called fluentd-<YYYY.MM.DD> e.g. fluentd-2022.01.25. To ensure that all indices are fetched, set index pattern name to fl* and click Next step:
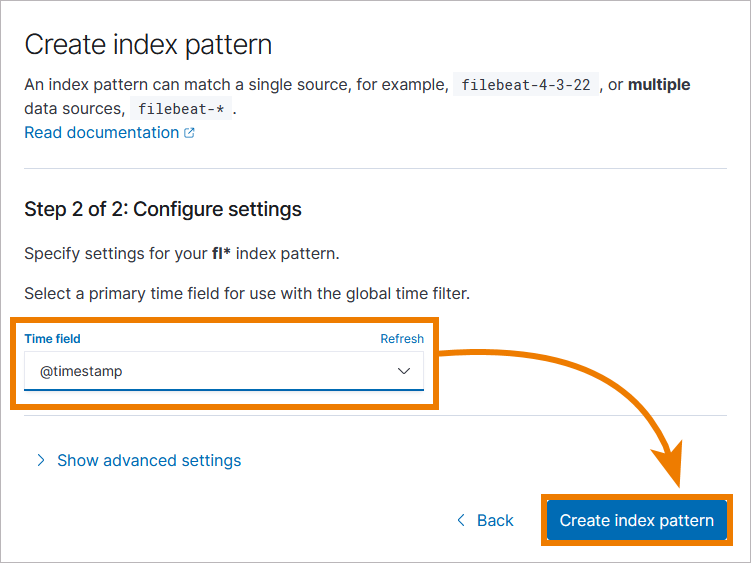
In the next window, open the drop-down list of Time field and select @timestamp. Then click Create index pattern:
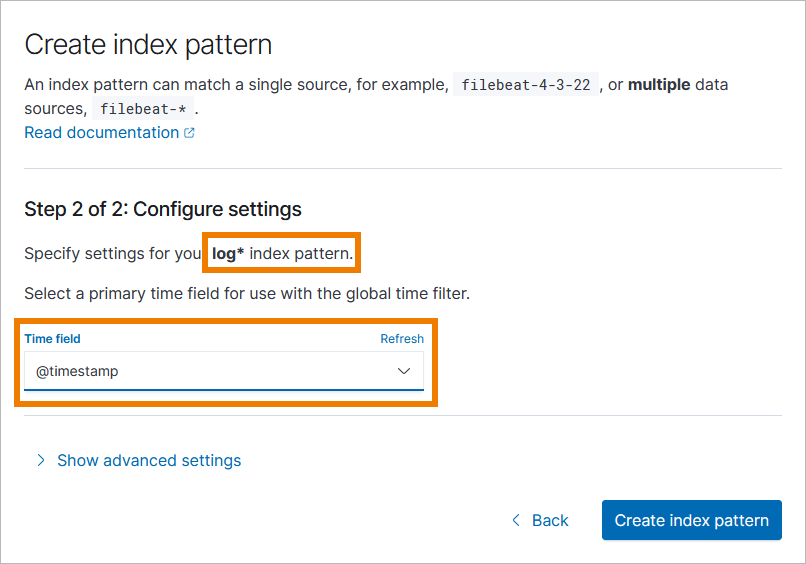
In Kubernetes setups, you need to create the index pattern logs* to access all PAS logs:
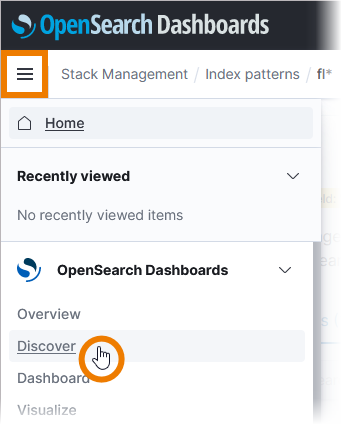
Open the menu and select option Discover:
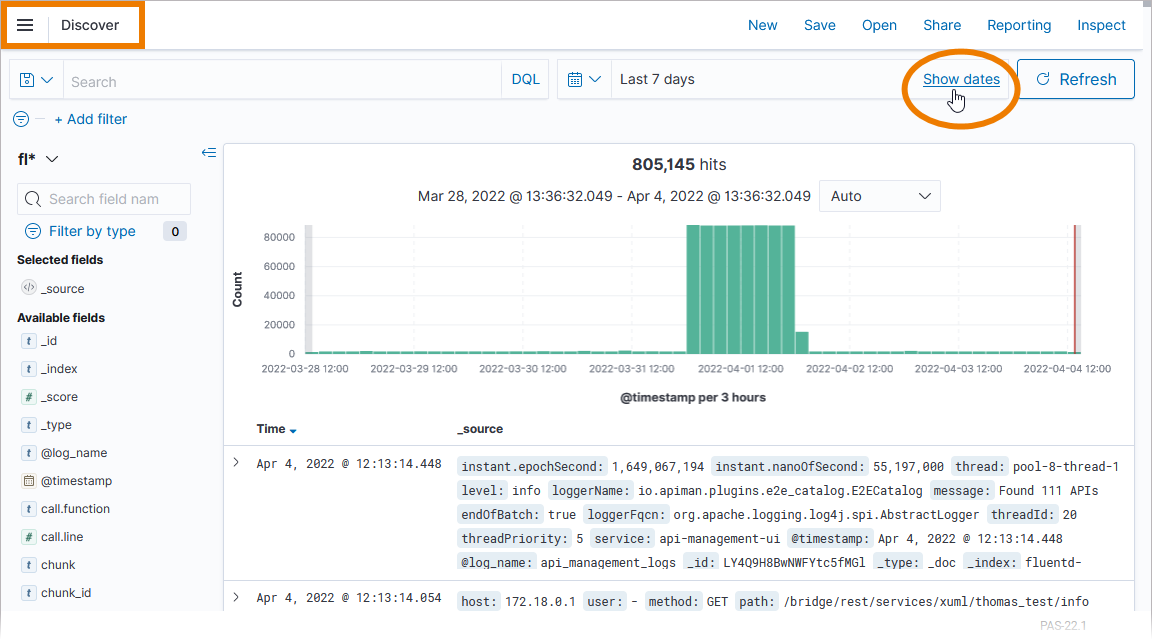
You can now inspect the service logs. If no logs are displayed, extend the time range:
Expert Tipp
To inspect the logs of a specific service, open the Log Analyzer from within the service details in the PAS Administration.
Docker Setup:
In the service details, open section Logs and use option Open Log Analyzer to inspect logs.
The Log Analyzer will open, showing all logs of this specific service.
Refer to Showing Docker Container Logs and Docker: Showing Logs of a Containerized xUML Service for more details.
Kubernetes Setup:
On a Kubernetes system, section Logs in the service details is divided in two parts: Service Logs and Transaction Logs.
In both parts you can find a button to open the Log Analyzer:
-
Open Service Logs: Shows the logs filtered by service name and log channel container.
-
Open Transaction Logs: Shows the logs filtered by service name and log channel transaction.
Refer to Showing Workload Logs and Kubernetes: Showing Logs of a Containerized xUML Service for more details.
Footnotes
Differences between Docker and Kubernetes
Customers can run Scheer PAS on a Docker or a Kubernetes setup.
If the behavior of Kubernetes and Docker differs, we highlight the text in different colors to clarify the differences:
-
Kubernetes-related text is highlighted in green.
-
Docker-related text is highlighted in blue.
Related Content
Related Documentation: