
The Control Hub does not display logs itself, but links to them. Use the Open logs action to open the logs for a project or component deployment in the third-party tool Grafana that we use to visualize log data.
For detailed information on Grafana, its features and how to use them, refer to the Official Grafana Documentation.
Opening Logs for a Deployment
The logs of a deployment cover all of its components. You have two options for opening it:
-
In the Deployments view: Select option Open logs in the quick actions column of the project deployments' row.
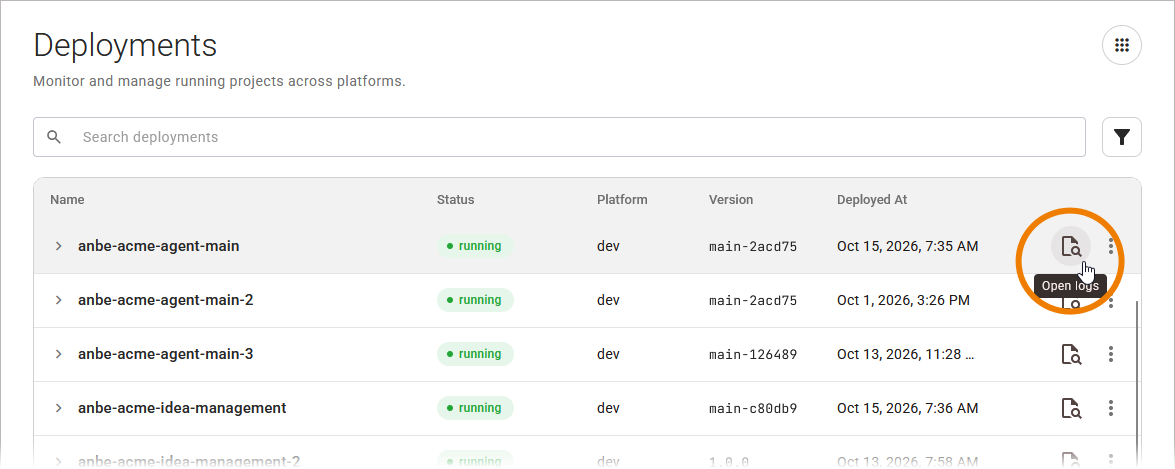
For more details about the deployments table, refer to Working With the Deployments View.
-
On the deployment details page: Select option Open Logs in the details section.
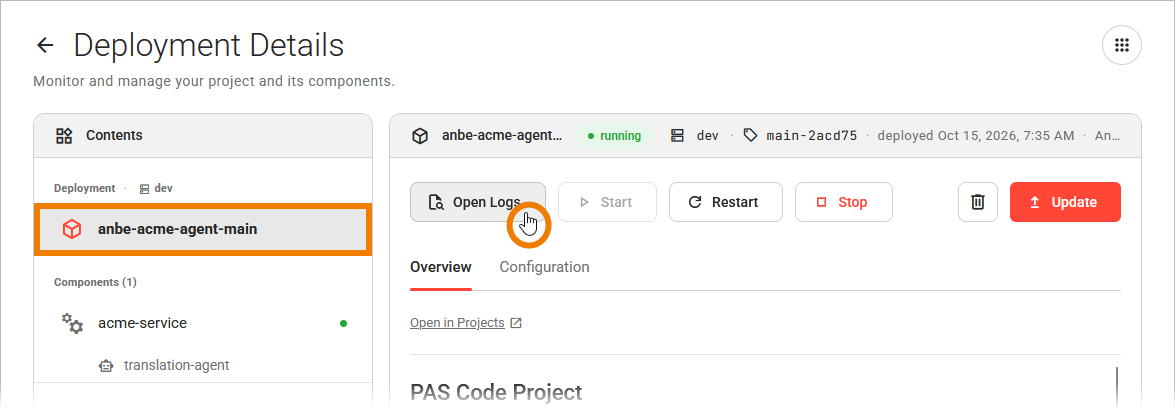
For more information on the deployment details, refer to Working With the Deployment Details Page.
The logs open in a new browser tab, the Control Hub remains open.
Opening Logs for a Component
The logs of a component deployment cover only that component. Components of all types produce logs. For apps, the logs from the nginx web server that delivers the app’s resources are displayed.
You have two options for opening the logs:
-
In the Deployments view: Expand the project deployment to list its components, then select option Open logs in the component deployments' row.
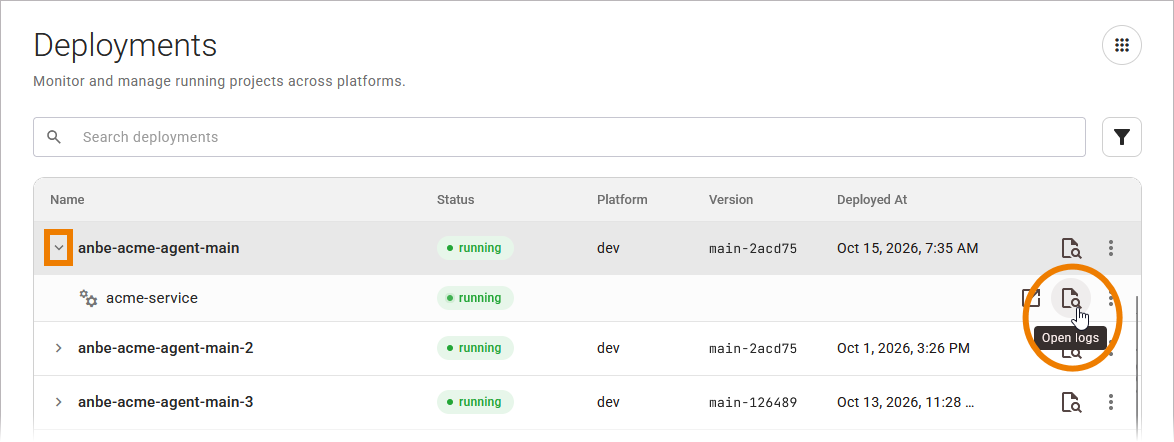
For more details about the deployments table, refer to Working With the Deployments View.
-
On the deployment details page: Select the component in the contents section on the left, then select Open Logs in the details section on the right.
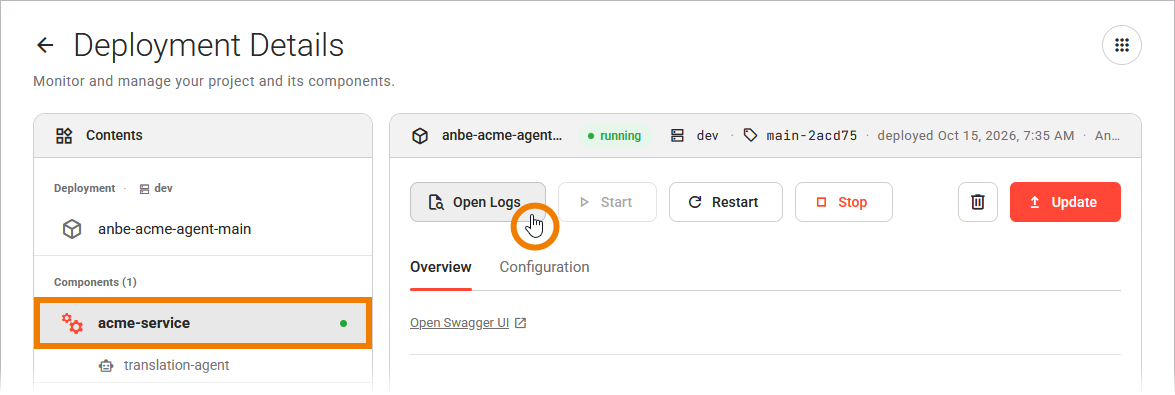
For more information on the deployment details, refer to Working With the Deployment Details Page.
The Log View
The logs are displayed in a Grafana dashboard. The Control Hub opens the service logs dashboard there and customizes the view so that you can go directly to the logs you requested:

The following settings are preset in the dashboard:
|
Setting |
Value |
|---|---|
|
Namespace |
Name of the Scheer PAS Code system |
|
Platform |
Name of the platform on which the deployment is running |
|
Bundle Deployment |
Name of the project on which the deployment is based |
|
Component |
The components covered by the action:
|
|
Log Level |
Default is All |
|
Fulltext Search |
Empty |
|
Time Range |
The last hour |
The Control Hub simply sets the initial view. All subsequent steps are performed in the Grafana tab: You can change the time range, search the log text, or add filters. Closing the Grafana tab has no effect on your deployment.
Logs are available whatever the status of a deployment is, so you can also read the logs of a stopped deployment or of one that reports an error.
Log Availability
The Open Logs action is displayed only when the Control Hub can build a link to the logs. It is hidden in the following cases:
-
Grafana is not configured for your installation. Ask your administrator to configure it.
-
The deployment has no components, so there are no service logs to show.
You can also ask the AI assistant about your logs instead of opening the service logs dashboard. Refer to Ask the Platform Assistant! for details.
Related Content
Related Documentation: