To view or edit test case properties, select Properties from the context menu of a test case or double-click it.
Switch to the Trace tab. Here, you can set the trace options:
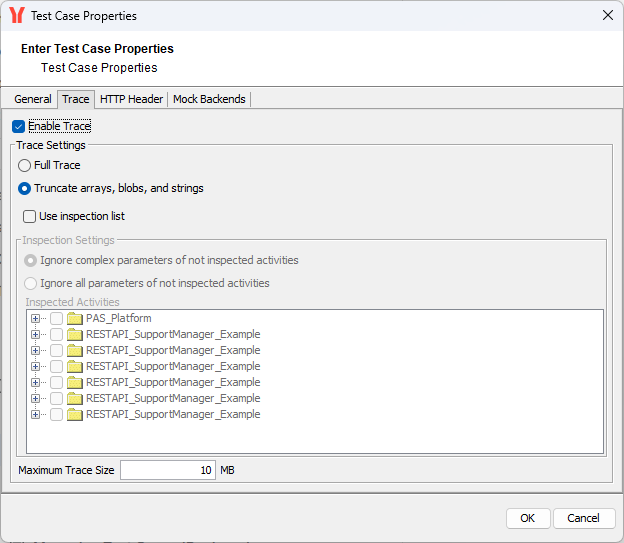
Enable Trace
Select the check box Enable trace, if you want the xUML Runtime to collect tracing information. By that, you can browse through a graphical representation of the test case run afterwards.
If you deselect check box Enable trace, no tracing information will be collected by the xUML Runtime.
Trace Settings
You can choose two Trace Levels.
-
Full trace: Complete tracing information is requested from the xUML Runtime.
-
Truncate arrays, blobs and strings: Limited tracing information is requested from the xUML Runtime. At this level, each string is truncated after 255 characters. Furthermore, only the first and the last element of an array are displayed.
In order to avoid memory problems on the system running the Trace Analyzer, you can limit the Maximum Trace Size. The default is specified as 10 MB. The minimum value is 1 MB.
Using the Inspection List
To request trace information for a specific activity, select the checkbox Use inspection list and select the activities to be considered from the containment tree of the Trace Analyzer:
However, per default, some debugging information for all activities, even the ones you did not put on the inspection list, is still available: values of input and output objects, which are of base type. Complex parameters (values of objects of complex type) of not inspected activities are always ignored (default option Ignore complex parameters of not inspected activities).
If you only want to inspect the activities on the list and do not even need values of base types, select the second option Ignore all parameters of not inspected activities.
Inspected activities can be removed from the inspection list by clicking Remove. Clicking View, will highlight the selected item in the containment tree.
Below, you can see how to add an activity to the inspection list. Select the activity and select Add to inspection list from the context menu. The selected activity will get marked by an eye symbol:
You can add activities and action nodes to the inspection list.
Related Content
Related Pages: