The Trace Analyzer is organized into two coordinated sections that target different execution styles and analysis needs.
-
Synchronous tracing
Send calls to services and inspect immediate results. To do this, you need to create test cases. -
Asynchronous tracing
Trace service calls asynchronously with a focus on event-driven, queued, or process-centric scenarios.
Overview of the UI and its Components
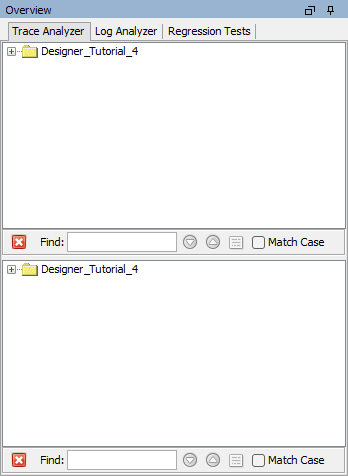
The interface is split vertically into upper and lower panes:
-
Upper pane: Synchronous Trace Analyzer
-
Lower pane: Asynchronous Trace Analyzer
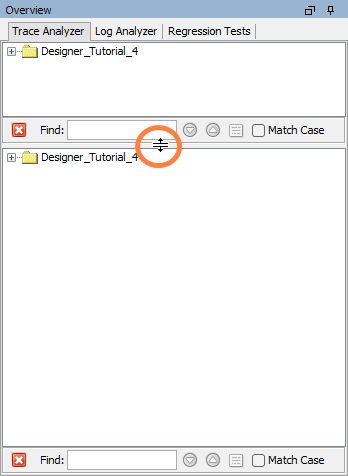
You can drag the divider between these panes to allocate more space to the area you are actively using. Expanding the lower section is common when deep-diving into asynchronous traces.
Related Content
Related Pages: