
The sidebar menu of the Control Hub links to the Development tools that run in your Agent Hub next to the Control Hub, for example:
The Control Hub starts where the build pipeline ends, so you use these tools to follow your work through the steps before: The Git service holds your source code. The build pipeline turns the source code into a published project version.
Tool Permissions
Each tool applies its own access rules. If you see a tool but are unable to open it, contact your administrator.
Each tool is an entry in a group of the sidebar menu, appearing after the Control Hub entries in that group.
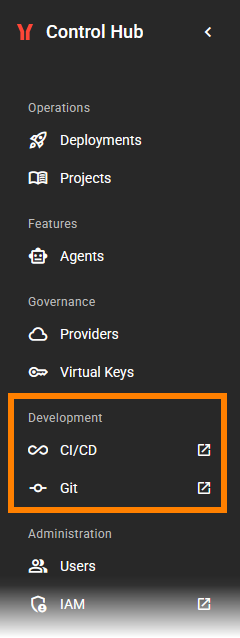
Click the entry in the sidebar to open the corresponding tool in a new browser tab.
CI/CD Dashboard
The build pipeline packages each project and publishes it as a version. A version appears in the Projects view after the pipeline has published it. Use the CI/CD dashboard to:
-
Follow a pipeline run that your push triggered.
-
Read the logs of a pipeline run to find out why a build failed.
-
Find out why a new version of your project does not appear in the Projects view.
The logs of a running deployment are not part of the CI/CD dashboard. You open them with the Open logs action, refer to Inspecting Logs for details.
Git
The Git service stores the source code of your projects and gives you access to a lot more functionality than the PAS CLI. For example, you can use it to:
-
Manage your SSH key.
-
Browse the repositories of your projects, their branches, and their commits.
-
Check that your push arrived and which commit a branch or tag points to.
-
Check the branches and tags of a repository or create a tag or new branch.
In the Projects view and in the Deployments view, the branch, the tag, and the commit of a project version are links. Click one of them to open it directly in the Git service. Refer to Inspecting the Project Details and Working With the Deployments View for details.
Related Content
Related Documentation: