The E2E Interactive Debugger allows remote interactive debugging of services running on an E2E Bridge.
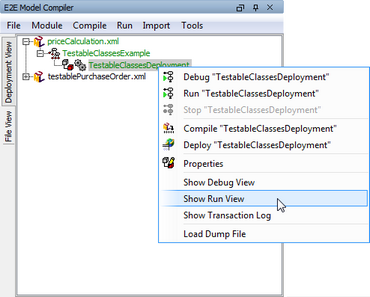
| Open the Run View to access the Remote Debug view. |
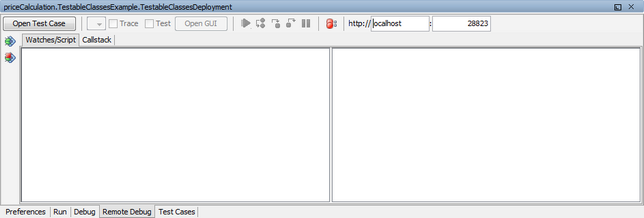
Switch to the Remote Debug tab.
In substitution of the corresponding actions available for interactive debugging, the following actions can be initiated via the Remote Debug view:
| Attach |
| Detach |
The service to attach to resp. to detach from is defined in the in the title bar by entering a host name of the E2E Bridge and the number of the control port of the service to be debugged. If the Interactive Debugger is attached to a service these fields will be grayed out.
All other available functions are the same as described for local debugging.
Overview
Content Tools