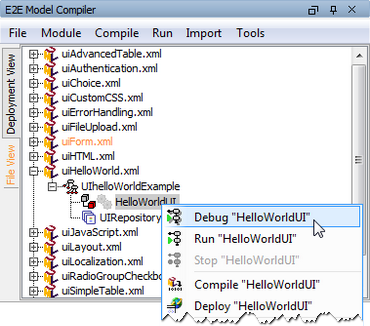
| For debugging purposes, the service has to be started in debug mode. |
After the xUML Runtime window showed the service starting up in the Run view, the Debug tab is displayed and the service is ready to be debugged.
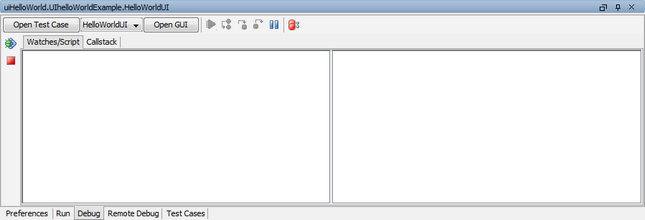
The following actions can be initiated via the Debug tab:
| Icon | Description |
|---|---|
| Start The service is saved (if necessary), compiled and started in debug mode. | |
| Stop The service running in this Run view is instantly stopped. | |
 | Switch to Test Cases tab The E2E Builder switches to the Test Cases tab to modify or start a test case. |
 | Select GUI From a drop-down list containing all UI definitions of the current model, one can be selected. This drop-down list is disabled if the model does not contain any UI definitions. |
 | Open Selected GUI The selected GUI (see Select GUI) is displayed in the default browser. This button is disabled if the model does not contain any UI definitions. |
| Go to next breakpoint The Interactive Debugger continues the execution of the model until it stops at the next breakpoint. | |
| Step over next action The Interactive Debugger executes all remaining action script statements of the current action and stops at the beginning of the next action. | |
| Step into next action The Interactive Debugger steps into the action and stops directly before executing the next action script statement. | |
| Step out of current action The Interactive Debugger executes all remaining actions of this activity diagram and returns to the calling activity. It stops at the next action of this superior activity diagram. | |
| Pause The service running in this Run view is paused at the next point possible. If the test case has not been started yet, this means the very first action of the service. If the service is already processing the request of the test case, clicking pause will lead to the service being paused at the next possible action. This is especially useful, if the service is trapped in an endless loop. | |
| Manage Breakpoints A window pops up and shows all breakpoints that are set in the UML model. Breakpoints may by selected or deselected. |
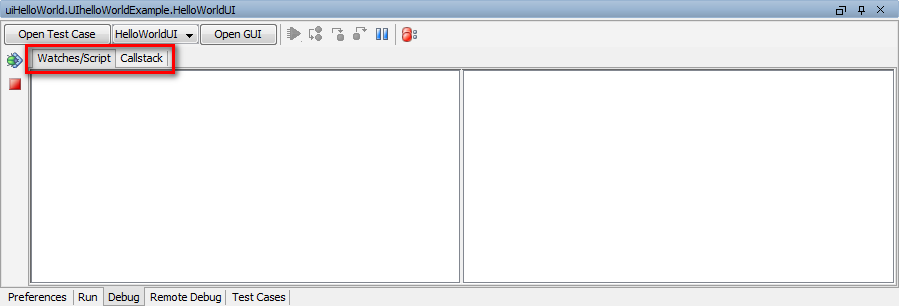
The Debug tab of the Run view consists of two tabs: Watches/Script and Callstack.
Overview
Content Tools