Having navigated to the action that is to be inspected, open the context menu of the concerning action.
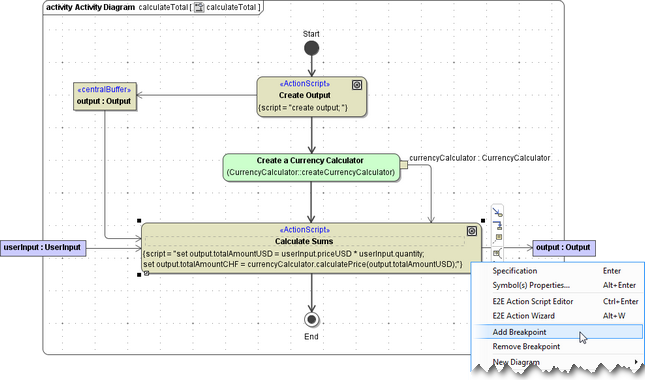
Select Add Breakpoint to add a breakpoint and Remove Breakpoint to remove one.
| The action node of an action having an active breakpoint is surrounded by a dark frame to indicate the breakpoint. |

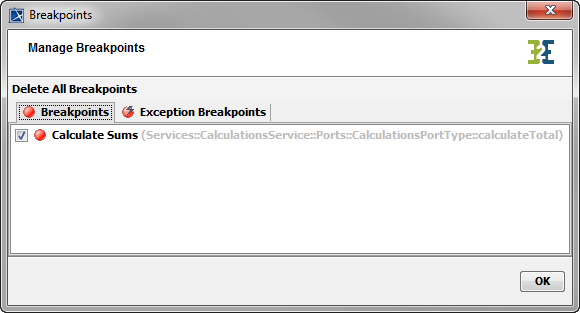
To get an overview on all breakpoints defined open the Breakpoint Manager window by clicking ![]() in the Debug tab.
in the Debug tab.
| All breakpoints of the UML model are listed and can be deactivated or reactivated by selecting the corresponding checkbox. Click OK to close the dialog. |
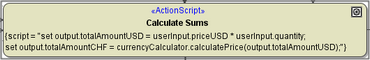
| The action node of an action having an inactive breakpoint is surrounded by a light frame to indicate that the breakpoint is deselected. |
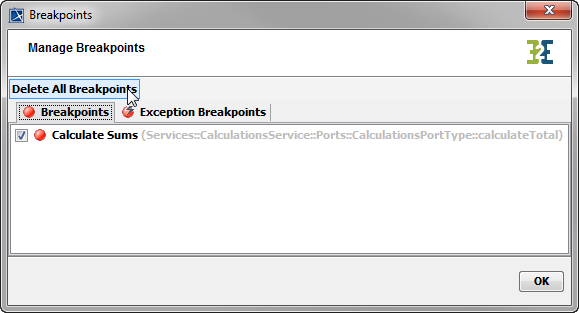
| To delete all breakpoints of the UML model select Delete All Breakpoints. |
| If the xUML Runtime stopped service execution on a breakpoint the corresponding activity diagram opens and the breakpoint halted on is indicated by a yellow frame. |
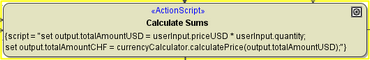
Example File (Builder project Testing Concepts):
| <your example path>\Testing Concepts\uml\priceCalculation.xml |
Exception Breakpoints
The Breakpoint Manager contains an additional tab to manage exception breakpoints. In the Exception Breakpoints tab, a default exception breakpoint is set:
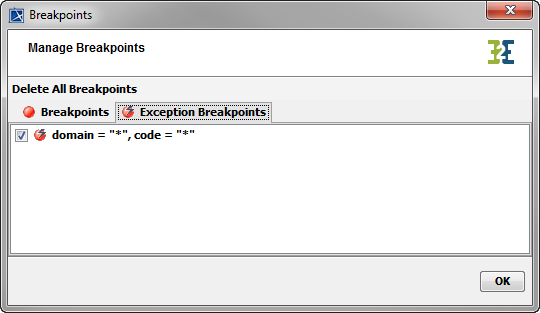
Disable the checkbox if you want to deactivate the default exception breakpoint.
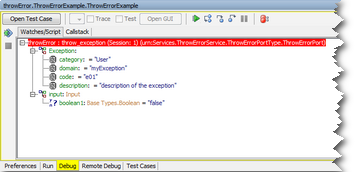
If an exceptions is thrown during model execution in debug mode, the Interactive Debugger stops at that point and creates an exception breakpoint.
| The topmost tree node shaded in red indicates, that the Interactive Debugger stopped on an exception. The exception details are displayed. |
| The automatically created exception breakpoint can be viewed in the Exception Breakpoints tab of the Breakpoint Manager. |
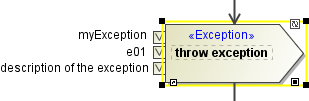
| Next time this exception occurs, the Interactive Debugger will indicate the UML element that caused the exception (which is in this example a manually thrown exception). To proceed with model execution click |
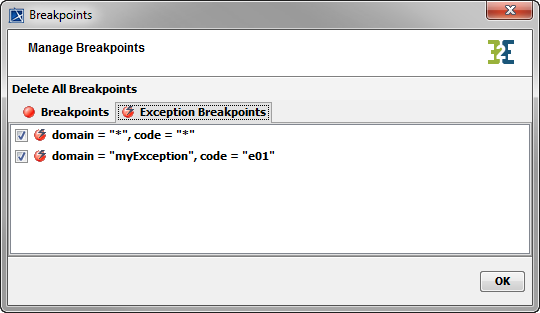
Example File (Builder project Basic Modeling/ErrorHandling):
| <your example path>\Basic Modeling\ErrorHandling\uml\throwError.xml |
View Dump File
In the service preferences of xUML services running on the Bridge, it is possible to set the flag Dump Context on Error. Each time the xUML service throws an exception, actual call stack and data is logged in a trace file.
These dump information can be viewed with the Interactive Debugger as a sort of exception breakpoint snapshot.
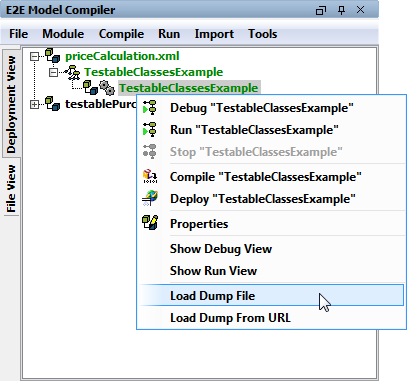
| Select Load Dump File or Load Dump File from URL from the context menu of the service deployment. |
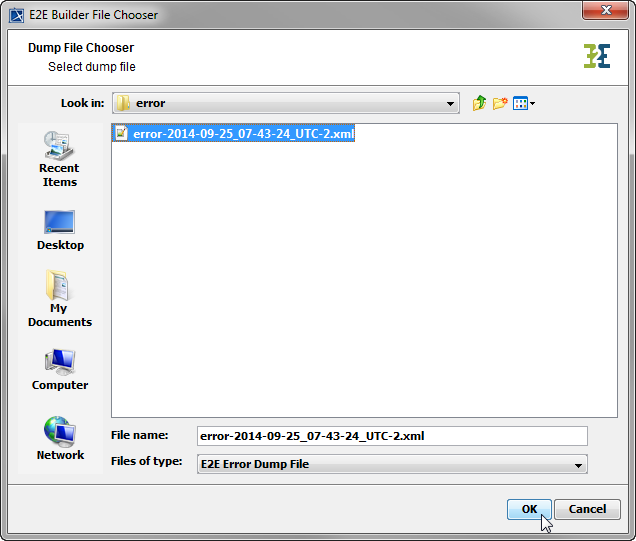
| Select the error dump file to display from the Bridge data directory and click OK ... |
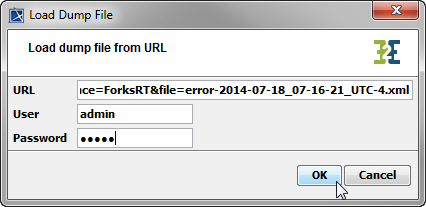 | ... or copy the dump file URL from the Bridge, provide your credentials and click OK. For more information on where to find the error dumps on a Bridge, refer to xUML Service Dump. |
The Embedded xUML Runtime window opens and shows an additional tab displaying the error dump information. The exception details can be inspected as described in section Exception Breakpoints and in Inspecting the Callstack. The erroneous action script statement is marked in red.
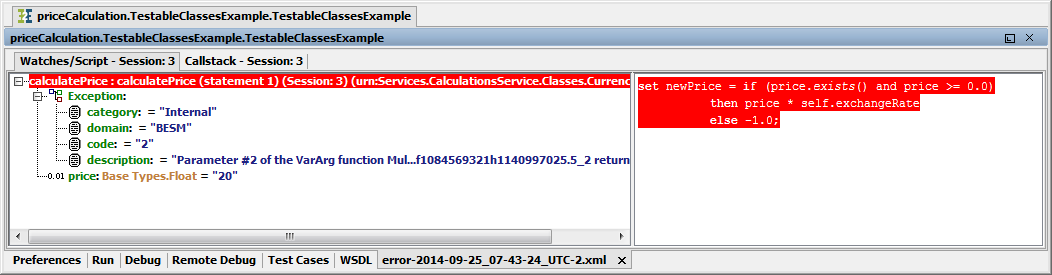
Additionally, the Debugger shows the UML element where the error occurred:
On this Page:
Overview
Content Tools