The Create New Analysis Wizard supports you during the creation of an analysis.
- In step 1 the user must select a chart type.
- In step 2 the process to be analyzed is selected
- In step 3 the axis allocation for the analysis is configured.
- In step 4 the user can finally create filters for their analysis.
Only the first three steps are mandatory, the creation of a filter is optional.
Creating a Filter
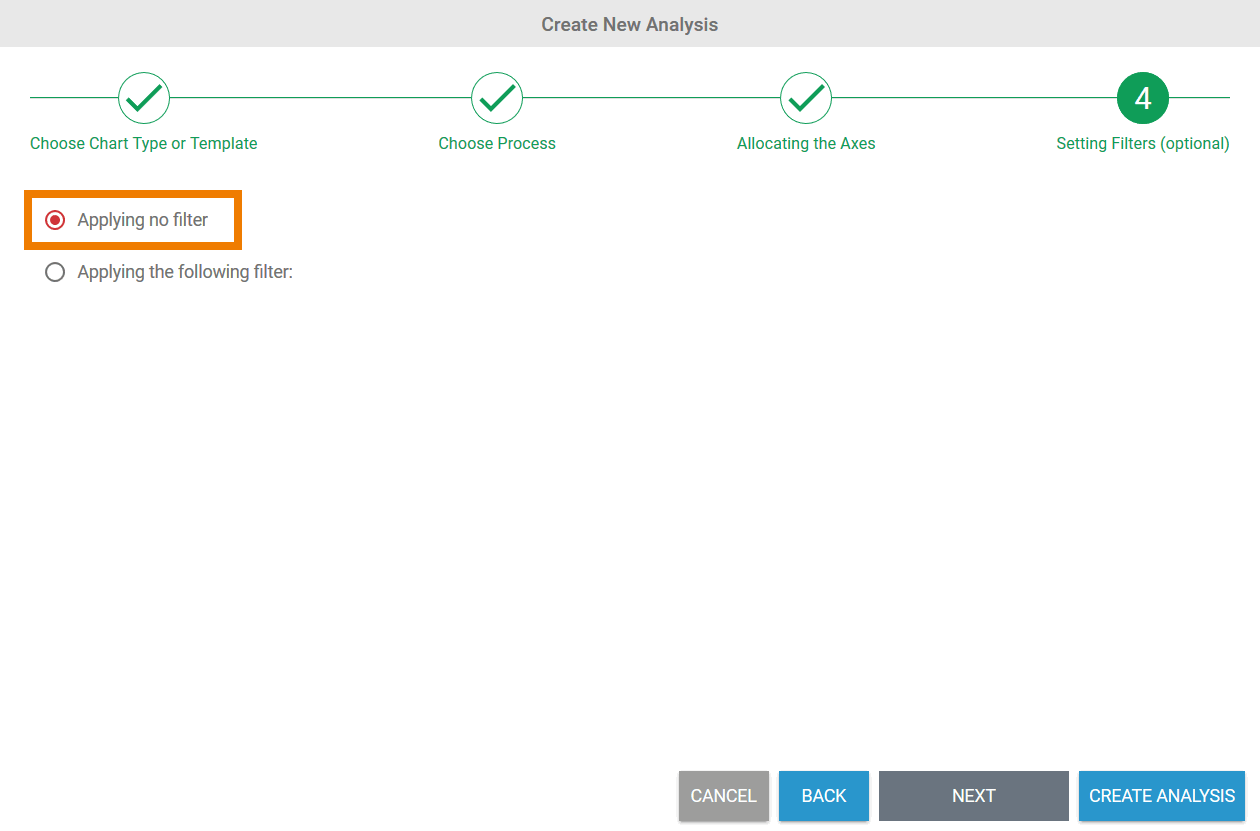
| In step 4 of the wizard, the option Applying no filter is selected by default. This means that all instances of the process selected are evaluated in the analysis. In step 4, it is still possible to create an analysis directly without a filter: Click Create Analysis to do so. |
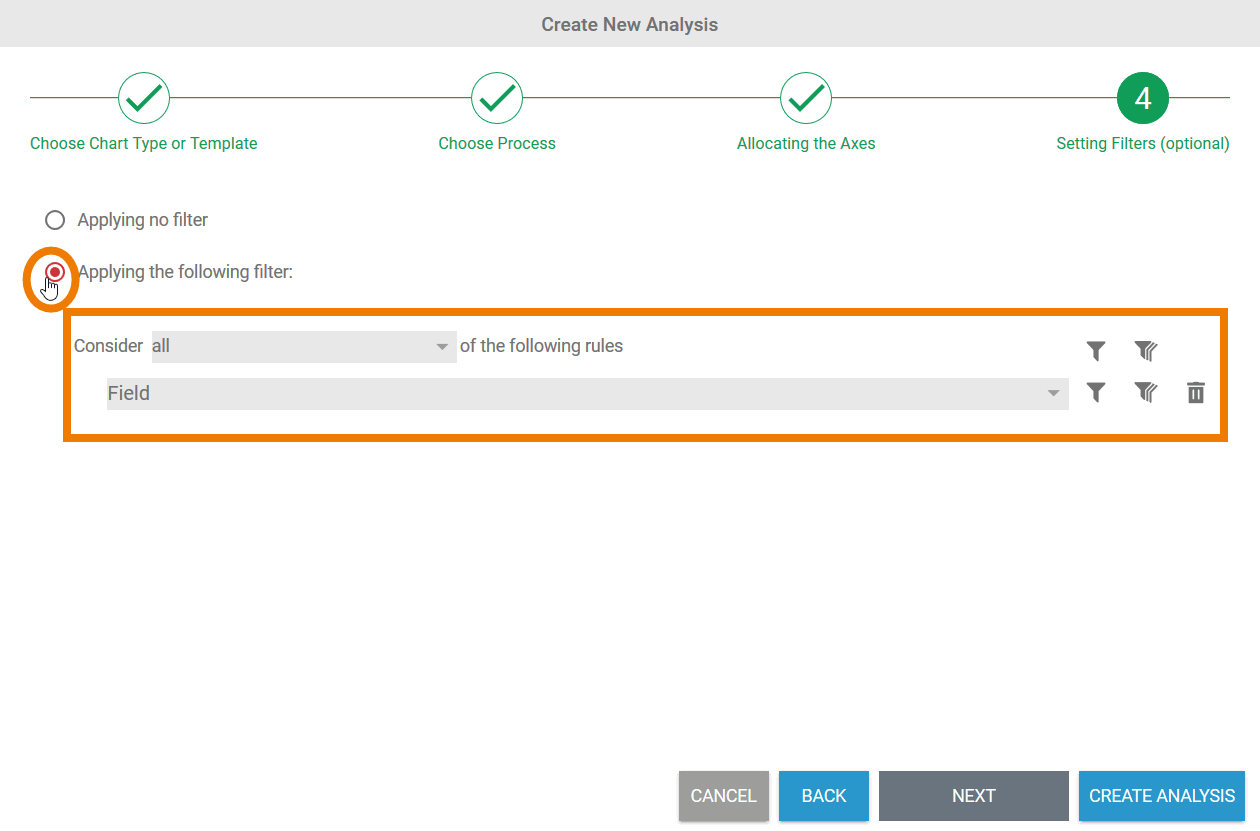
| If you change the option on the create following filter function, the filter entry is displayed. |
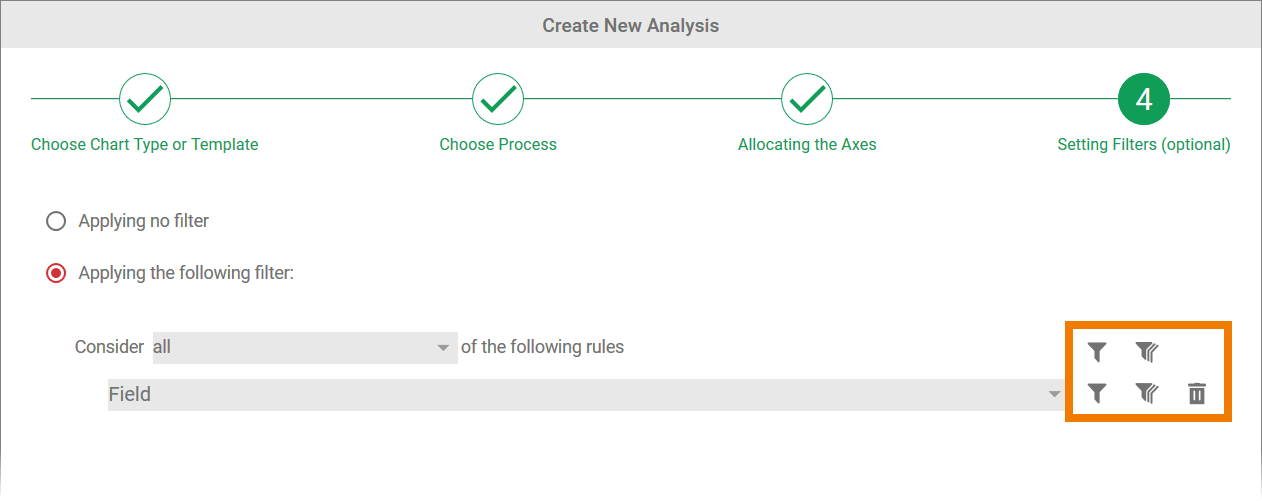
| Use one of the following options to manage your filters: |
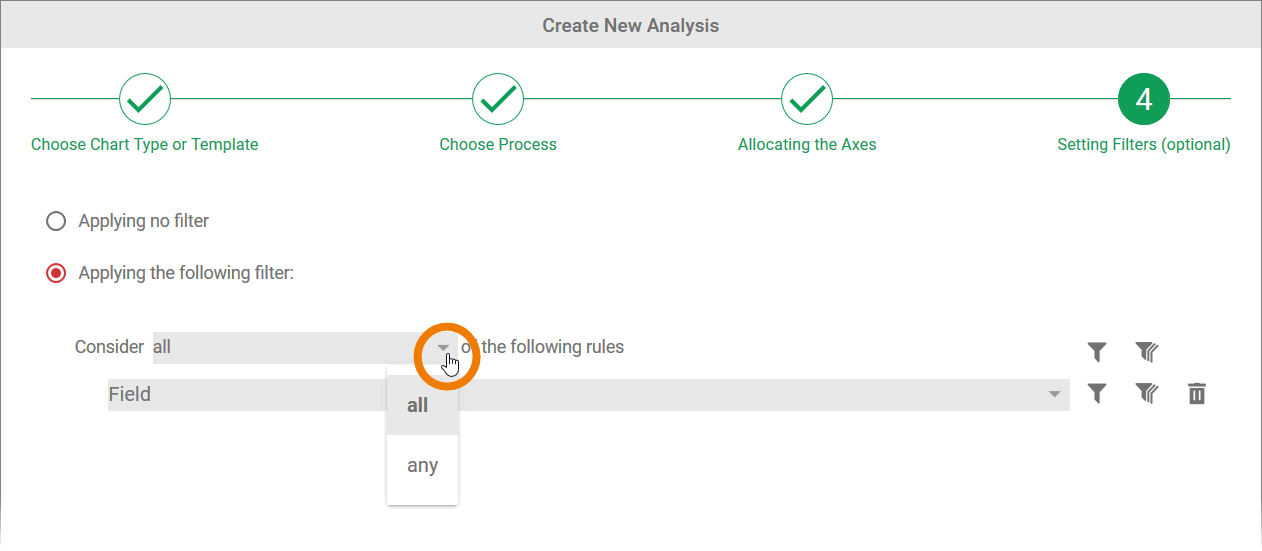
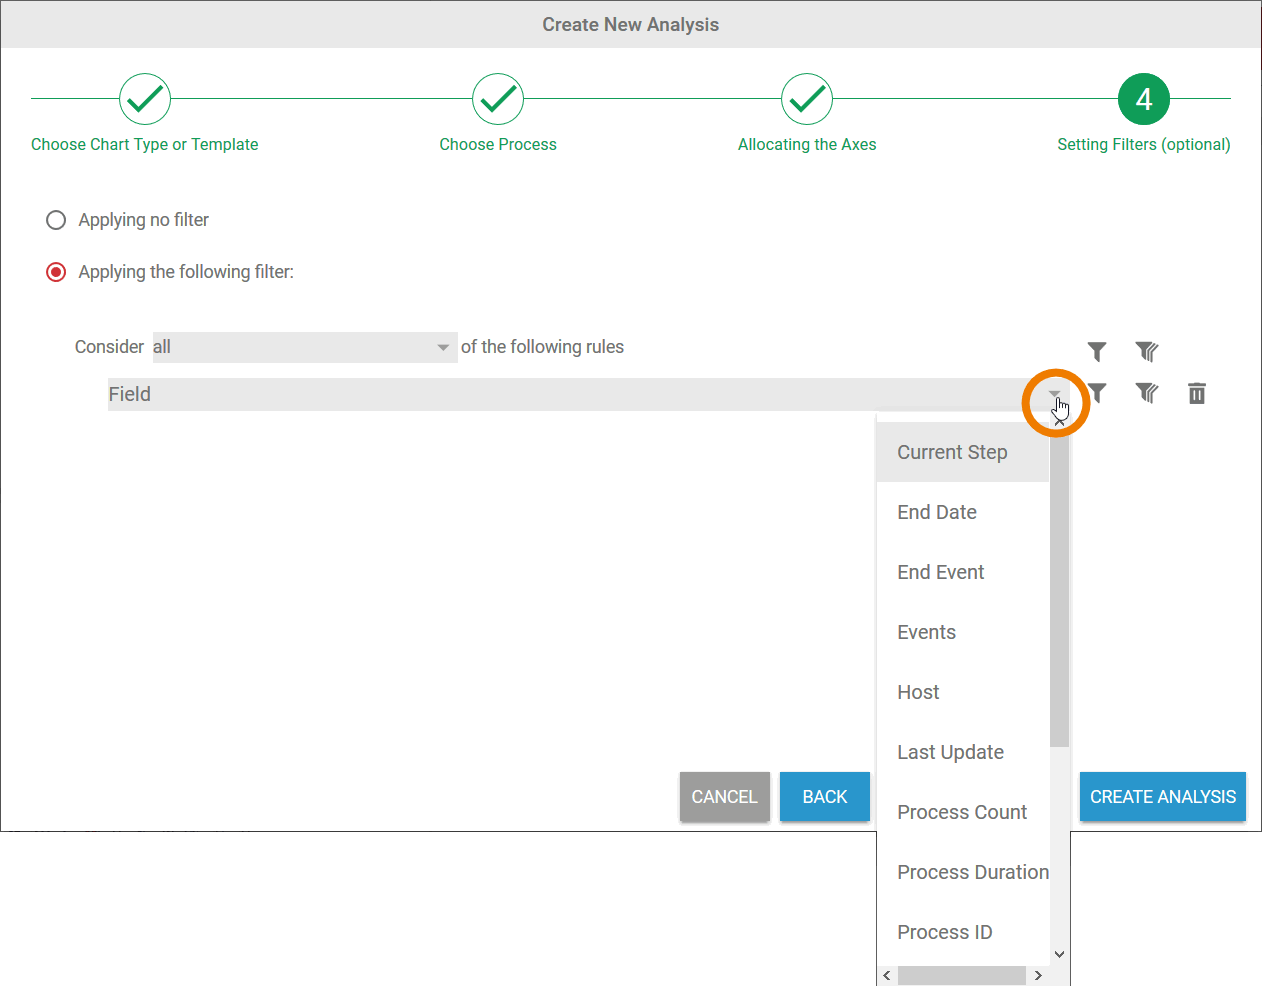
| In the first field, the selection list is the basis for determining filtering: |
Creating an Attribute Filter
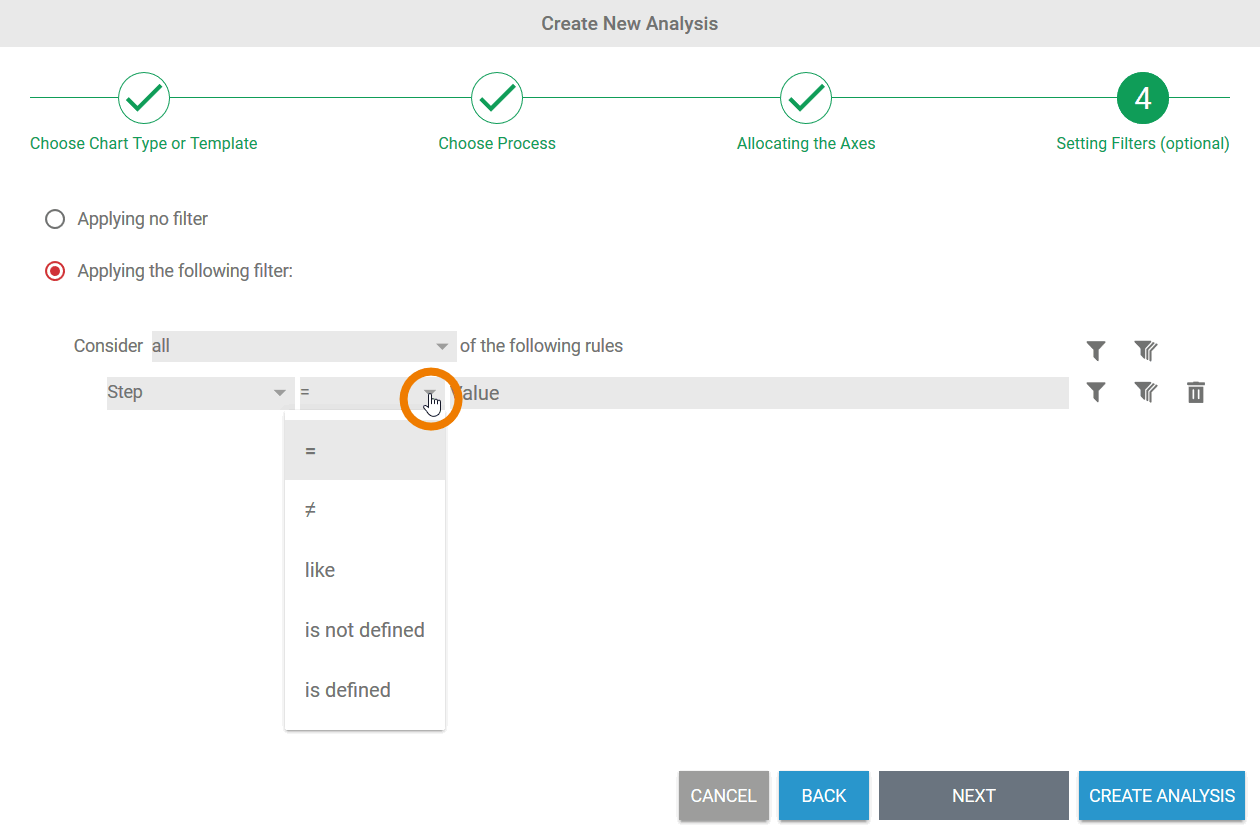
| Once the basis for filtering has been defined, you can create individual attribute filters: To select an instance attribute, expand the Field selection list. |
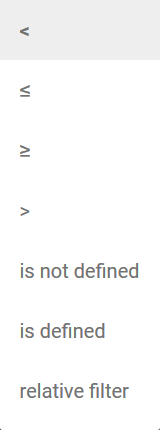
| Depending on the selected instance attribute, various operators become subsequently available. The available operators can be displayed via a selection list. |
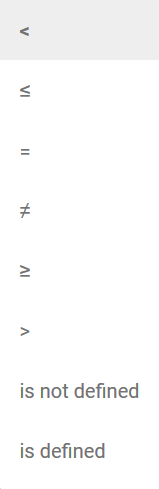
Available Operators
A distinction is made between four groups of instance attributes and the operators belonging to them: Current step End event Host Process name Process ID Start event Step manual input* * Except when operators is defined / not defined Process time Step duration Process count manual input* * Except when operators is defined / not defined End date Last update Start date Calendar (date picker) and manual input of the time * * Except when operators is defined / not defined and relative filtering If relative filtering is selected, the following options are available via an additional selection list: user-defined (manual input, refer to Relative Filtering) Event Steps Manual inputOperators Instance Attributes Value Input 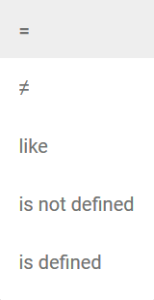
Inserting Values
| You can enter the related value if an operator has been selected. |
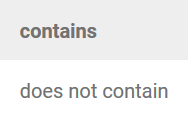
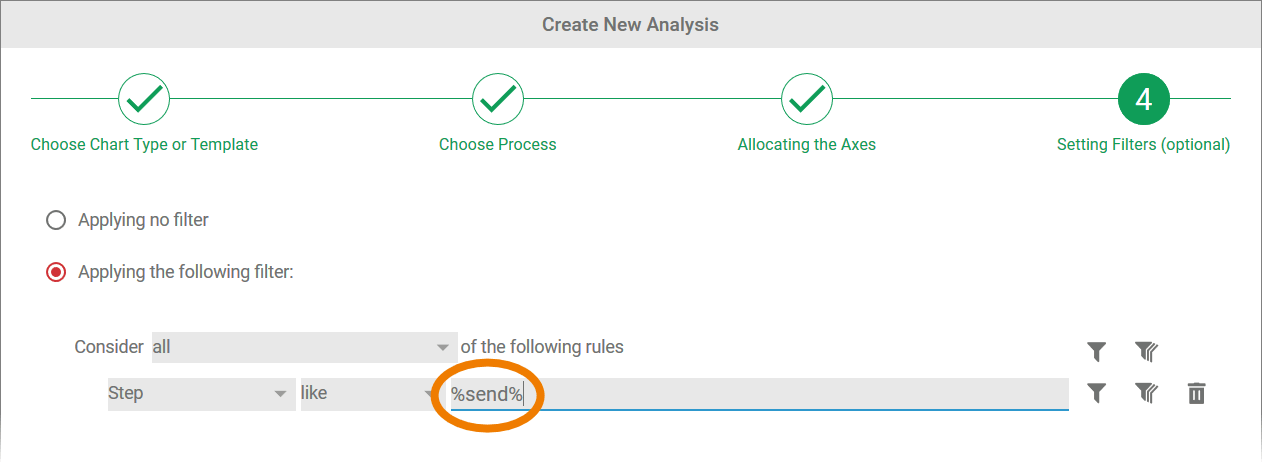
Using Wildcards
| If you choose the contains operator, you can use wildcards for entries in the value field. The following placeholders are allowed: |
| Example: Step contains %end% All instances containing the string end in the step instance attribute will be displayed. Steps in which additional characters appear before or after the string end are also taken into account. |
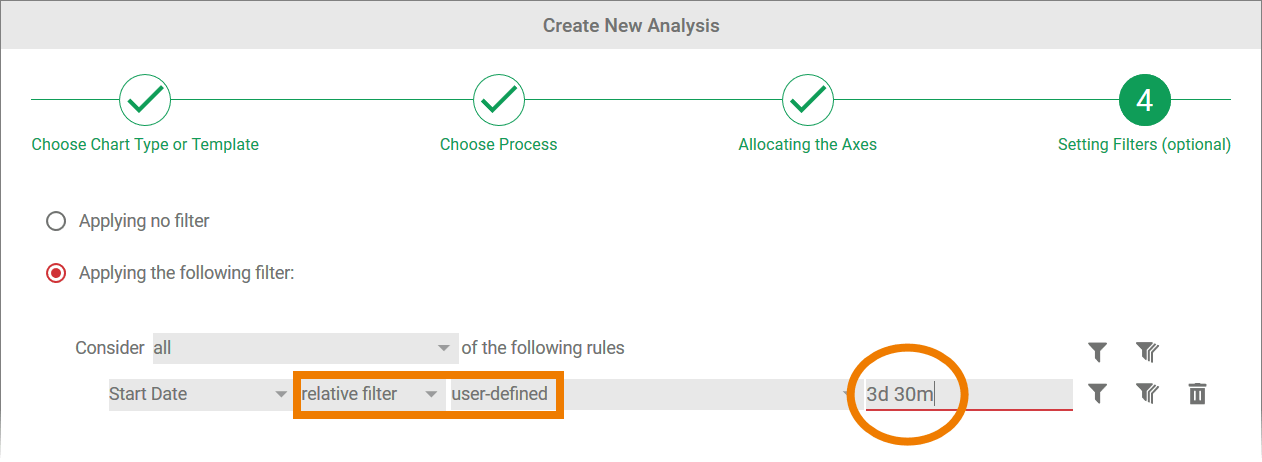
Entering a Duration
| Duration periods (process duration, step duration) are entered as whole numbers. A single number is interpreted as meaning a time unit of seconds. |
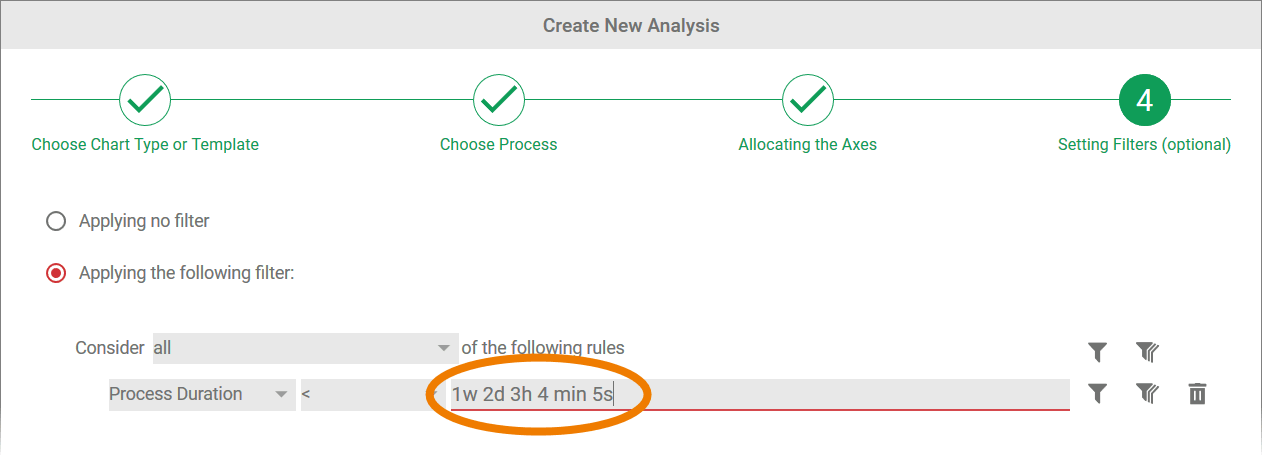
You can also use the corresponding abbreviations to enter weeks, days, hours and minutes: Time Units Permitted Input
(upper and lower case scripts are allowed)Week w, week, weeks Day d, day, days Hour h, hr, hour, hours Minute m, min, minute, minutes Second s, sec, second, seconds
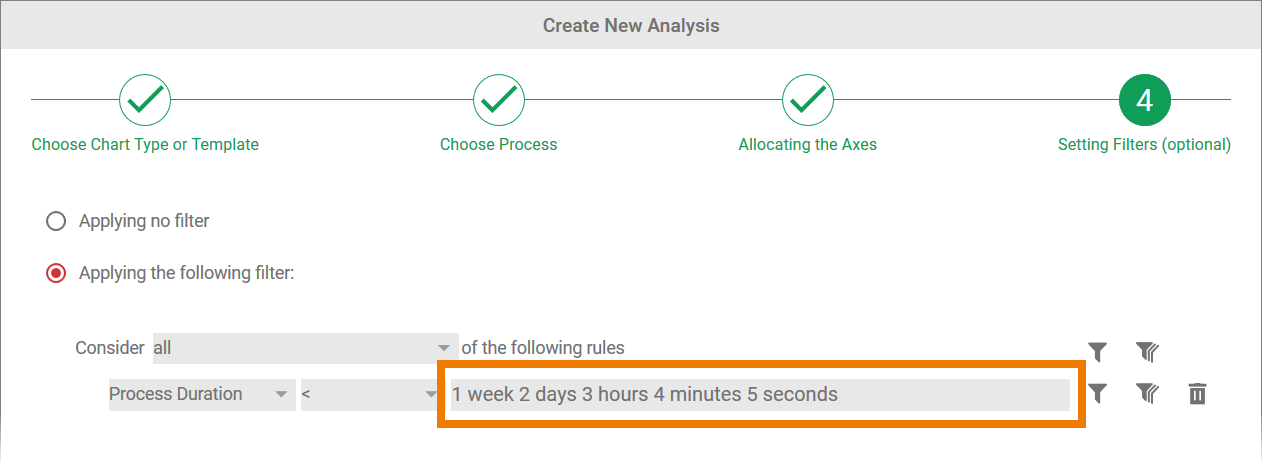
| After completing the entry, the applied time units are written out automatically. |
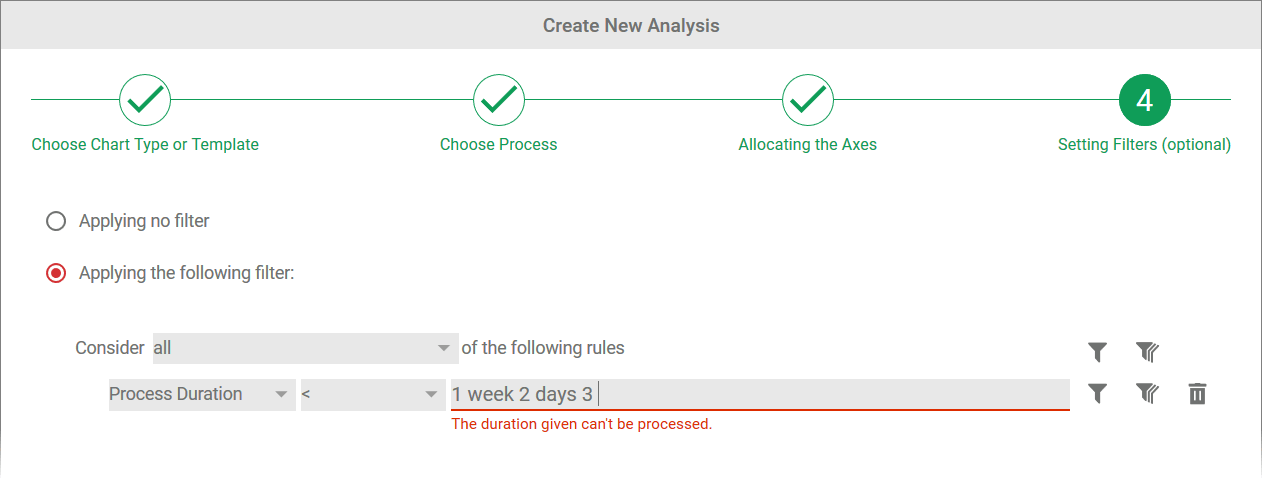
| If a time unit entry is not clearly defined, a corresponding message will be shown. |
Relative Filtering
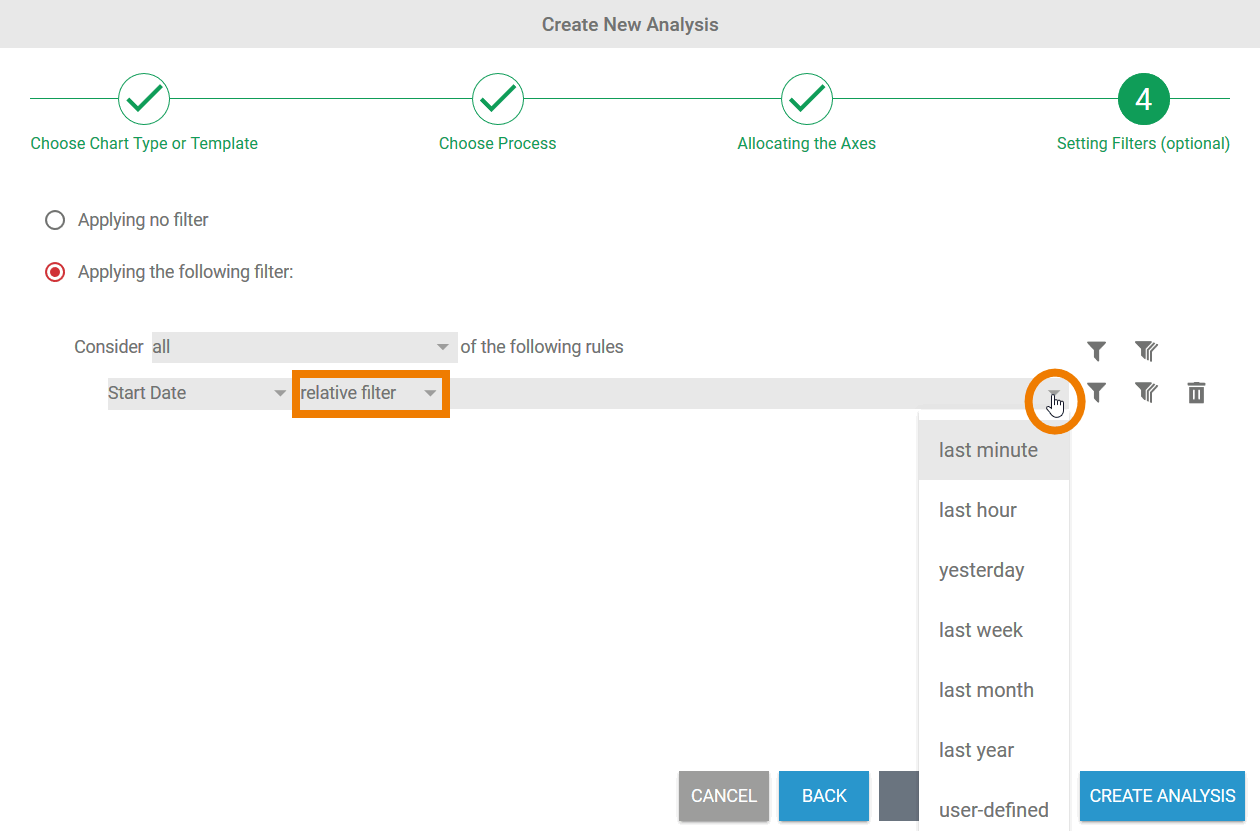
The operator relative filter is available for the instance attributes End Date, Last Update, and Start Date.
| Use the selection list to set predefined filters. The following selections are available:
|
| If you choose the option user-defined, you can enter the desired duration manually (see Entering a Duration). |
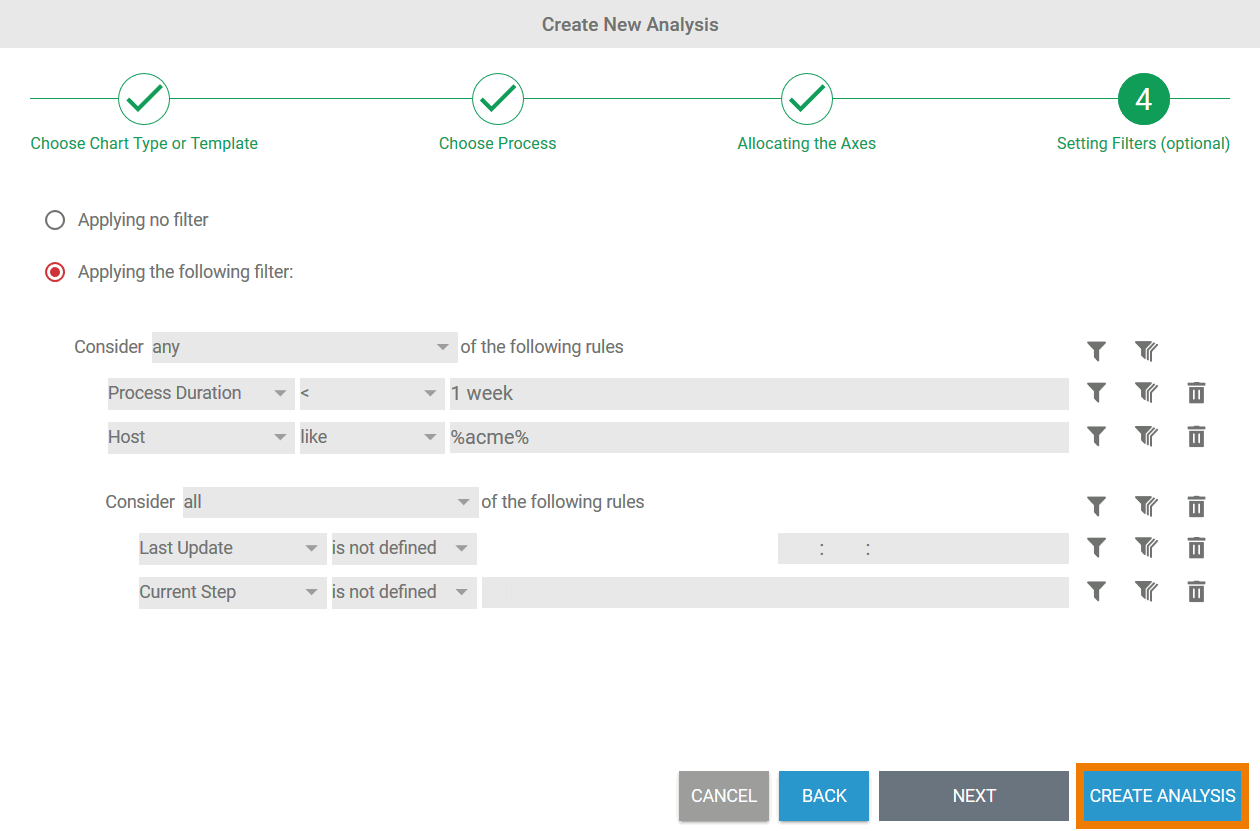
Nesting Filters
| You can create as many filters as you wish. Filters can also be nested to any depth. Once you have finished entering the desired filter, you can create the analysis using the Create Analysis button. |
Creating Filters Specific to Measures
If an analysis has been configured with several measures (refer to Configuring Axis Allocation for details), you can also create measure-specific filters.
The creation of measure-specific filters is not available for pie charts and tachometer charts as these charts can only be configured for one index number at a time.
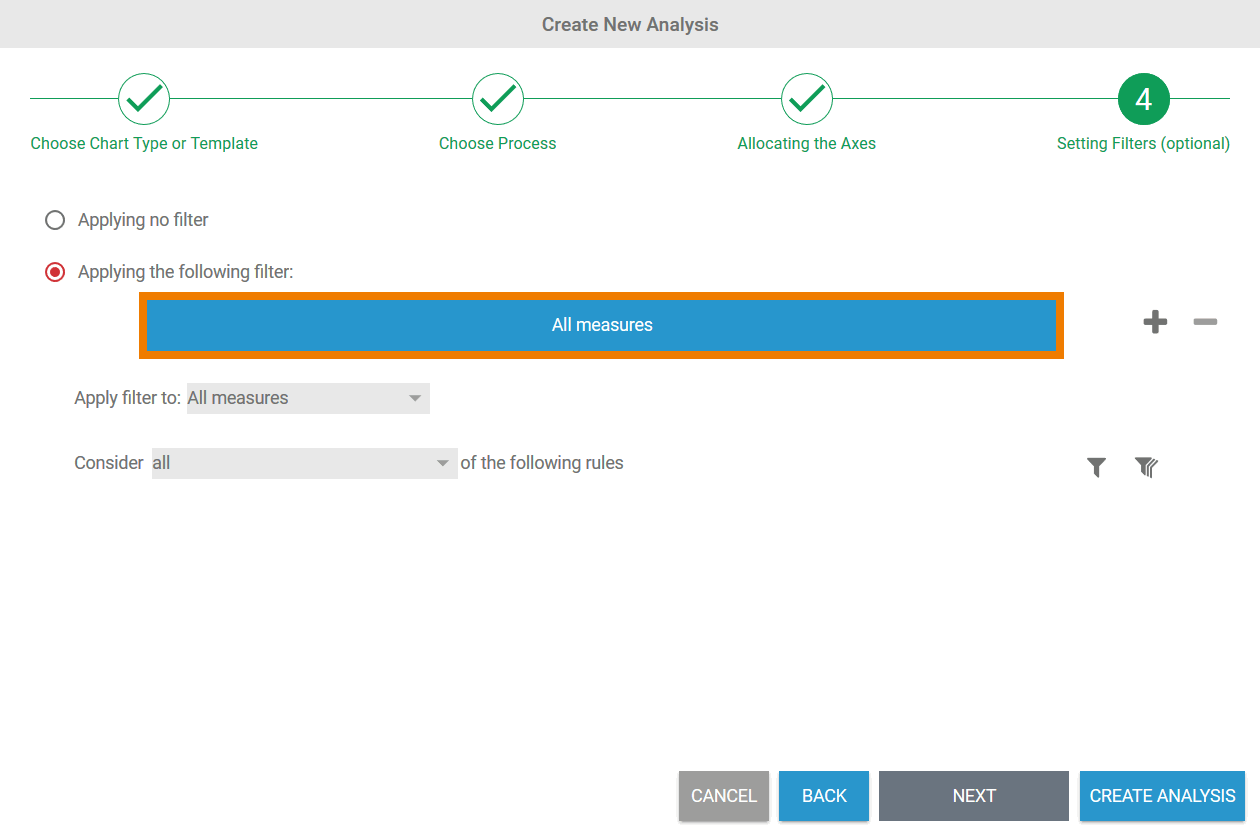
| If you have saved several measures on an axis, the All Measures tab appears when you open the filter wizard. If you configure filters in this tab, the filters are applied to all allocated measures. |
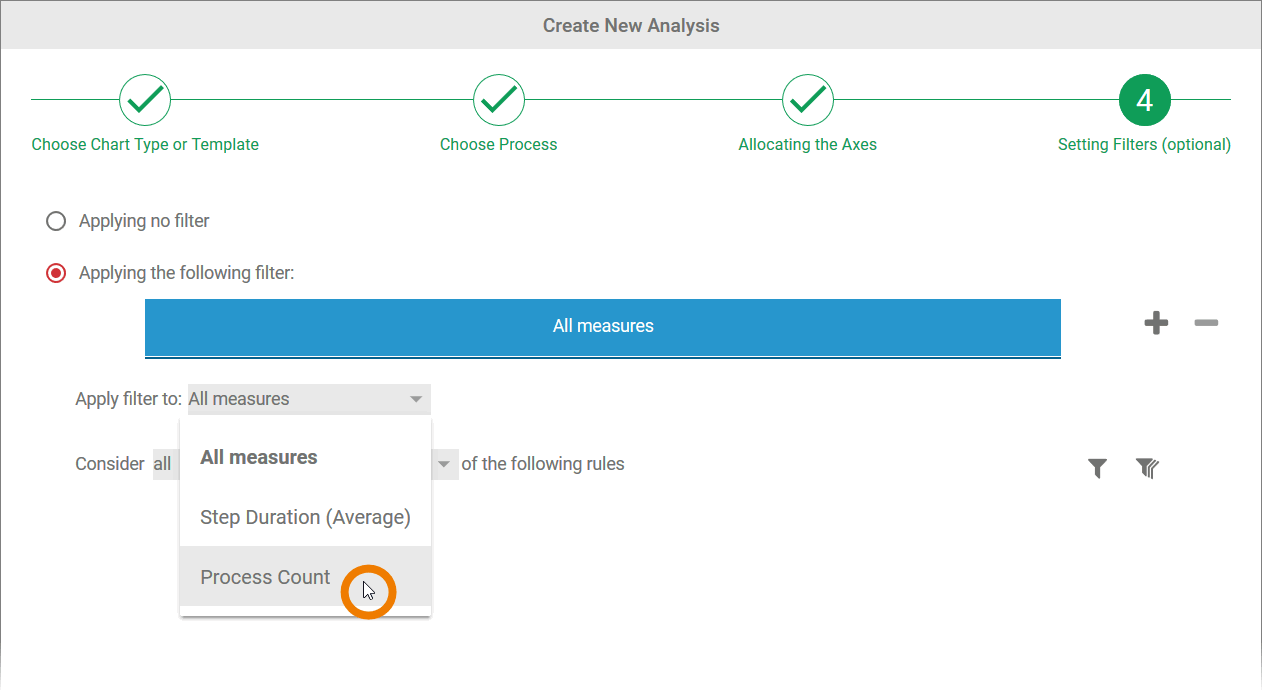
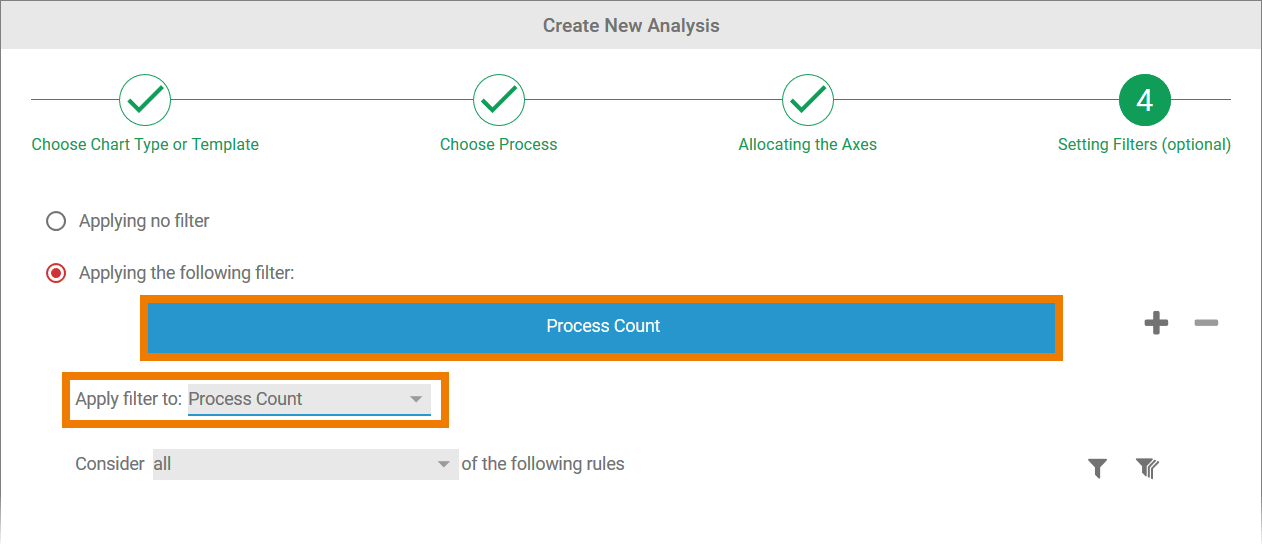
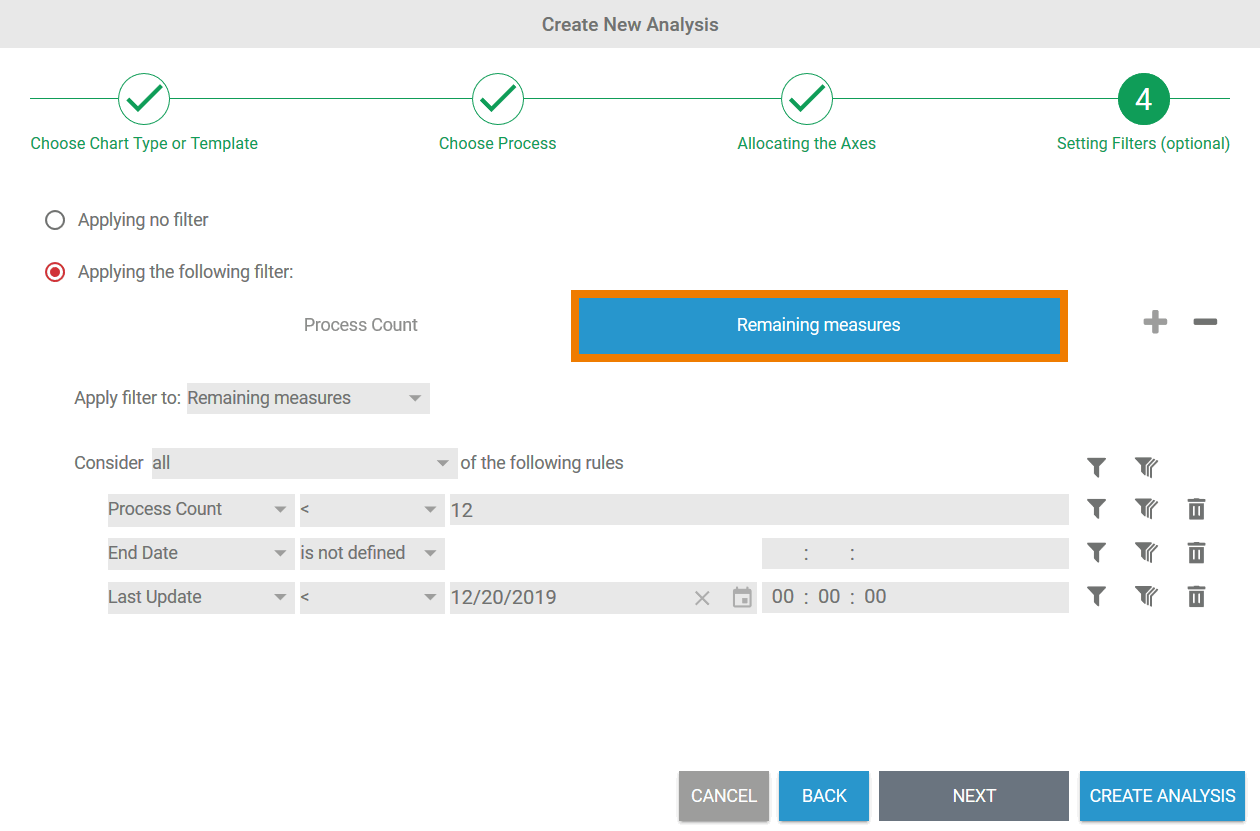
| In addition to the global All Measures filter, you can create measure-specific filters. To change the existing global filter to a filter specific to a key measure, open the selection list Apply filter to and select the corresponding measure. |
| The selected measure is transferred to the tab. All filters that you create now only affect the selected measure. |
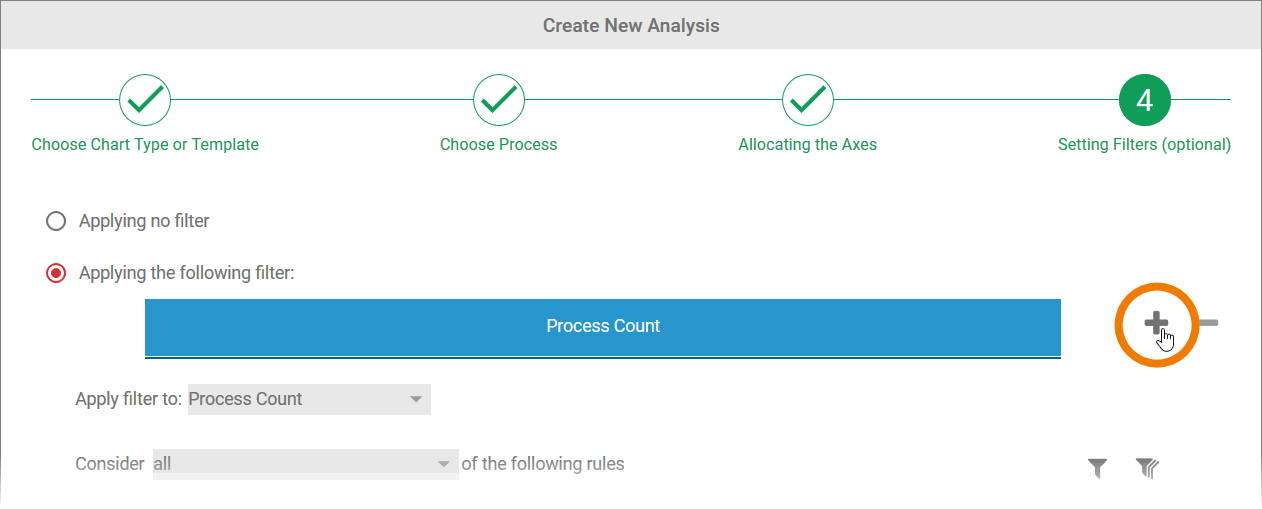
| If you wish to create additional measure-specific filters, use option |
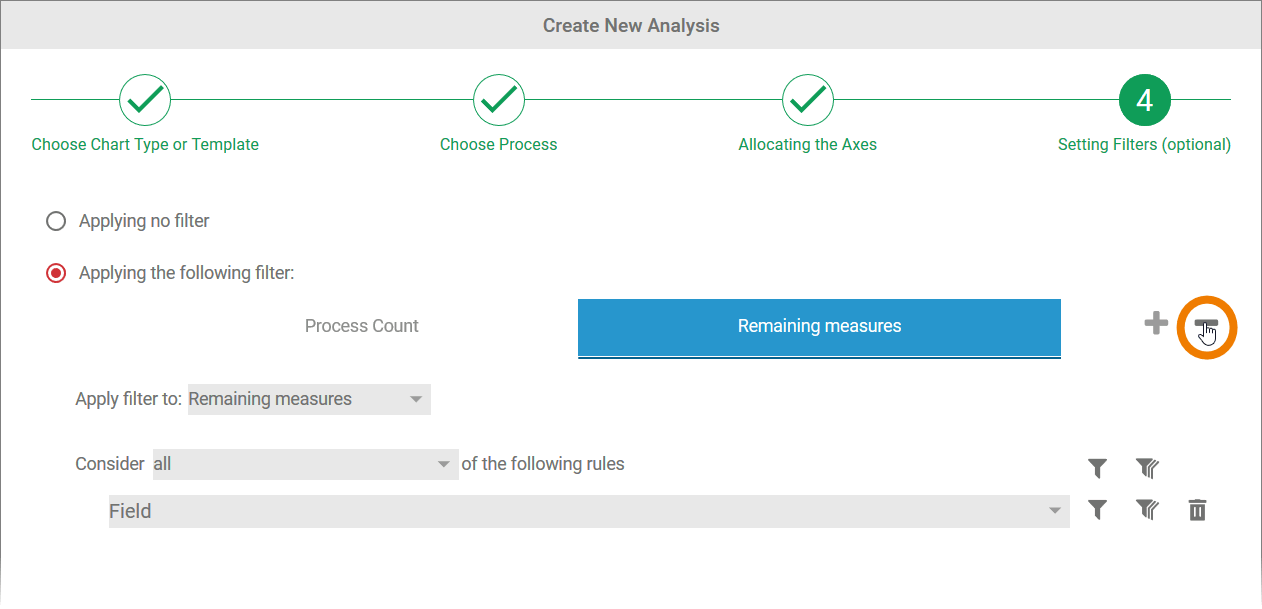
| Use option |
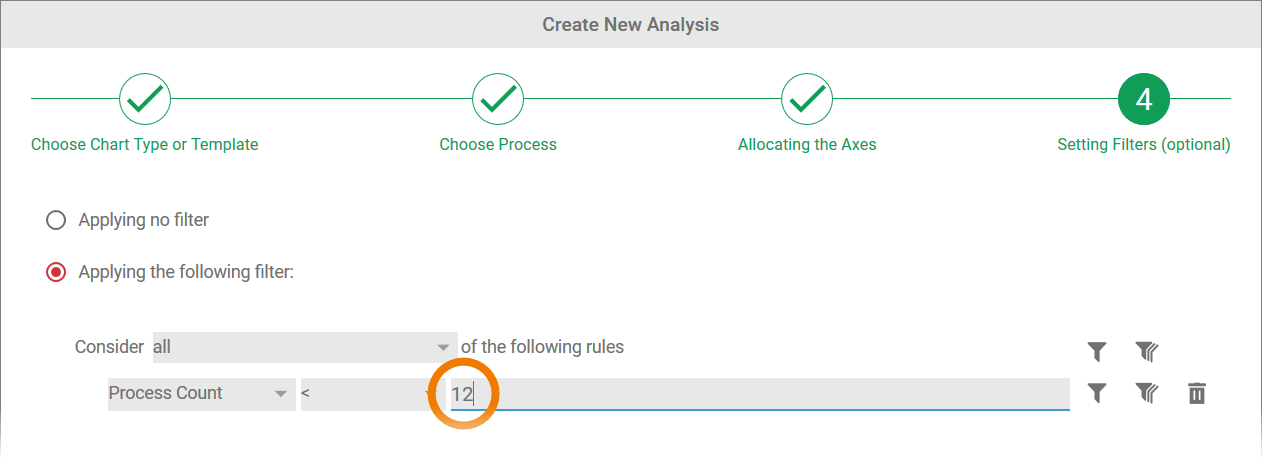
| Once a measure-specific filter has been created, the global filter no longer applies to this measure. The name of the tab therefore changes from All measures to Remaining measures. Example: The filter Process Count < 12 in tab Remaining measures will not be executed. Filters to be applied to the Process Count must be saved in the Process Count tab. |
Changing Filters
When all required filters have been created and the analysis has been created, the chart is displayed in the Process Analyzer. The settings for the analysis are shown in the sidebar:
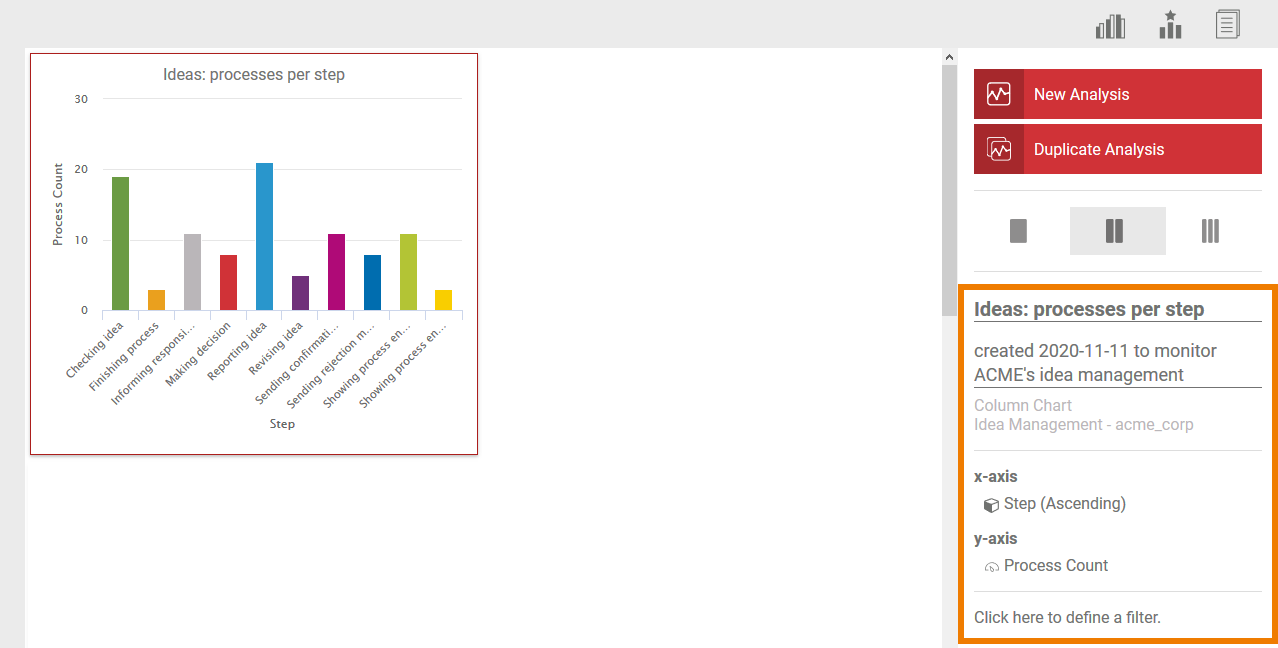
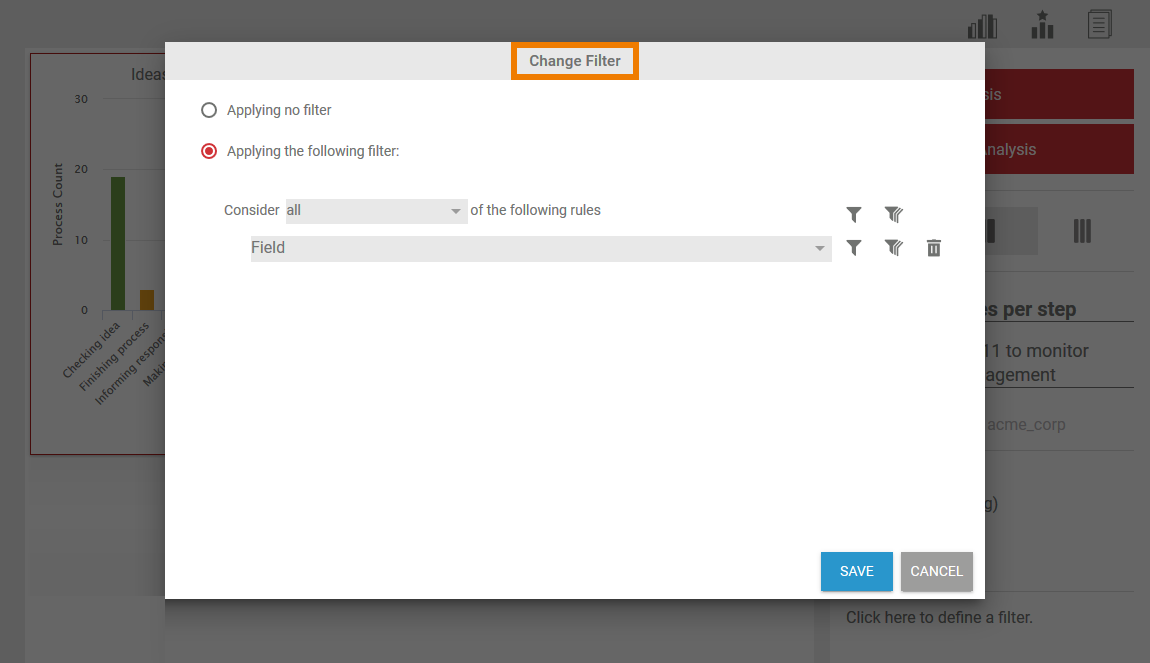
Use the sidebar to assign a name and a description to the analysis. You can also edit the filter settings via the sidebar. Click in the Filters section in the sidebar to open a pop-up window where you can adapt existing filters and also create new ones:
Overview
Content Tools