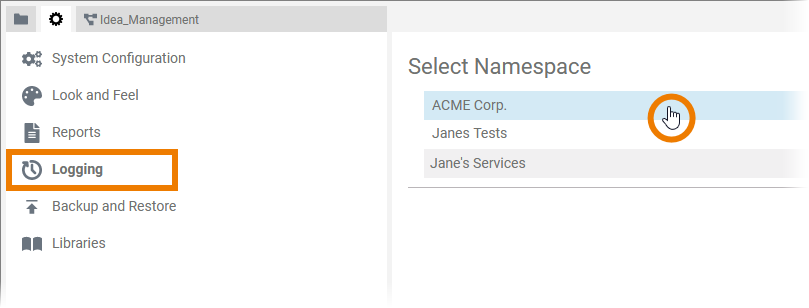
| If you want to read the logs, open the Logging menu and select the namespace for which you want to see the log. |
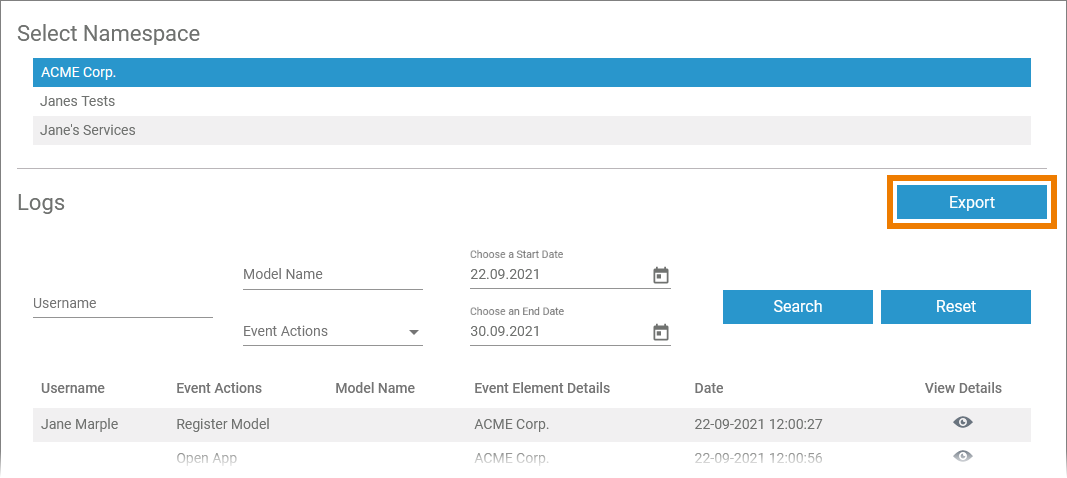 | The selected namespace is highlighted in color and section Logs is displayed. You can use the Export button on top to export the logs into a csv file. |
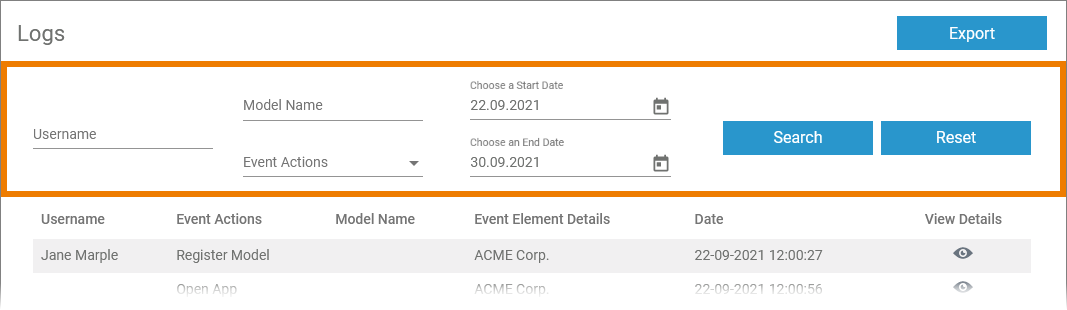
Filtering the Log Entries
| Logs may contain big amounts of data and in these cases it may be difficult to find the piece of information you are looking for. Therefore, you can filter the log entries by
|
| Filter Element | Description | Default |
|---|---|---|
| Username | The user that triggered the event.
| empty |
| Model Name | Name of the model that the event occured on. Field can be empty.
| empty |
| Event Actions | The action that occured.
| empty |
| Start Date | Select the period for which you want to inspect the logs, beginning with a start date.
| today -7 days |
| End Date | Select the period for which you want to inspect the logs, ending with an end date.
| tomorrow |
Click Search to update the displayed logging information.
Click Reset to restore the default (all search filters are cleared, start and end date will be set to the default).
The filter settings will be reset to default as soon as you leave the Logging tab and also if you switch to the logging of another namespace.
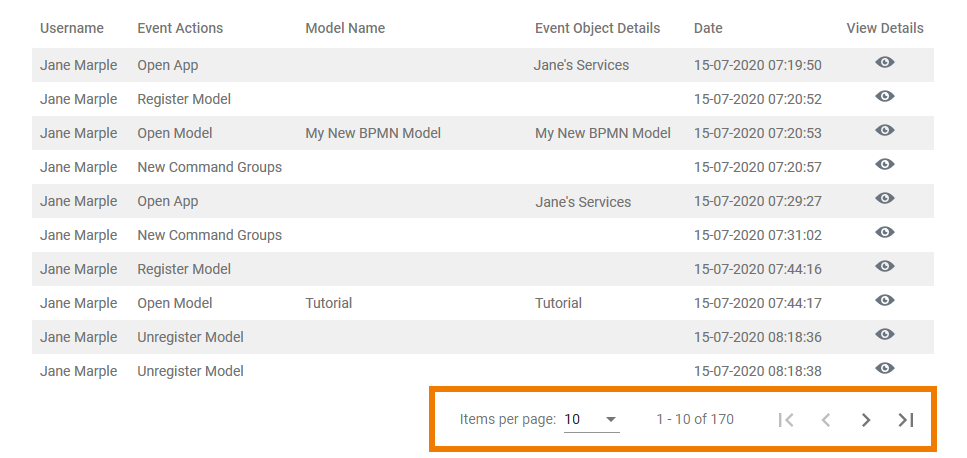
The Search Results
| The results according to your search conditions are displayed in a paged list. Use the navigation bar at the bottom to manage the log list:
| ||||||||||
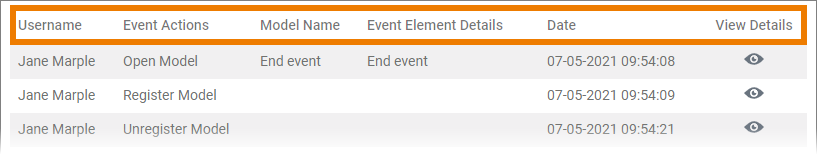
| The log list shows the following information:
| ||||||||||
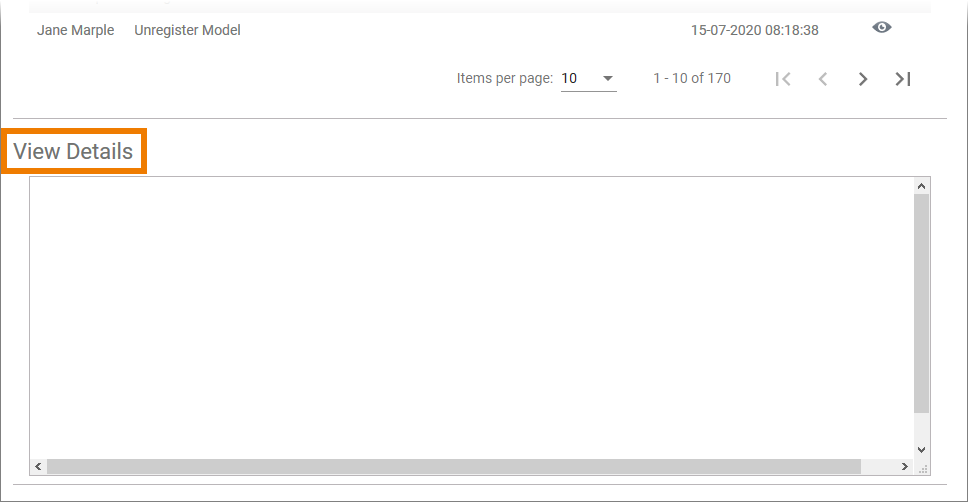
| Below the log list section View Details is displayed. | ||||||||||
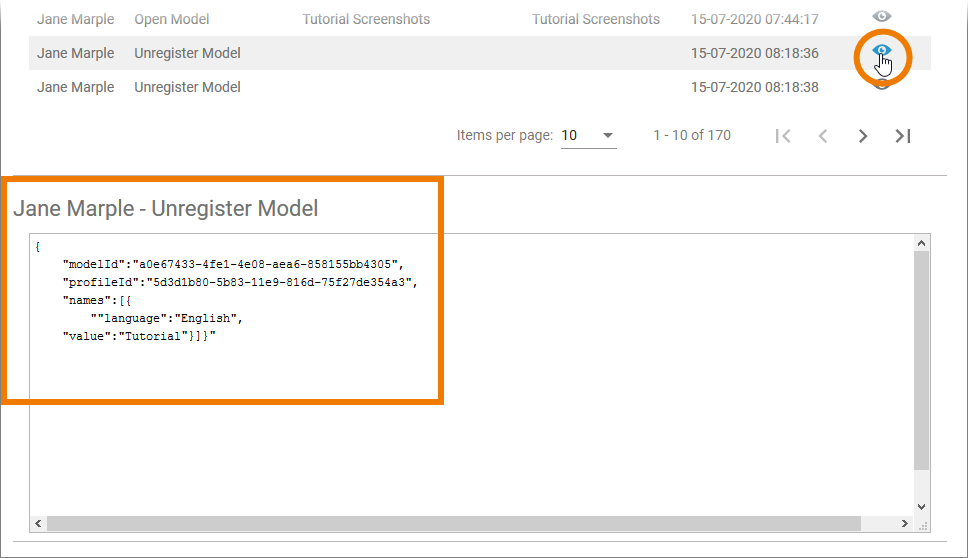
| Click on the icon |
On this Page:
Related Pages:
Related Documentation:
Overview
Content Tools