To really see the information you need at a glance, you can adjust the table columns in the data section. As per default, the table shows
- a detail column
This column contains a Details button to retrieve all details of this process instance. This column cannot be changed. - ProcessID
- Start Date
- Start Event
- End Event
- Duration
The table header contains some interactive elements that you can use to change the table layout.
|
|
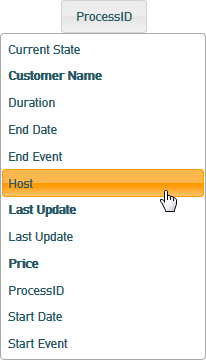 | Click the column label to see a drop-down list of all available data fields and select one. The column names that are displayed in bold are custom fields. For more information on how to define custom fields refer to Logging Custom Values to the Dashboard Database. |

Exporting the Data
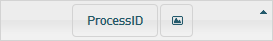
At the top of the data table, you will find two buttons: Copy and Excel. Use these buttons to
- copy the visible data to the clipboard
- save the visible data to an .CSV file
Visible data means the view as displayed is exported. All table columns and table rows, that are displayed on the page, are exported and all column adjustments and filters are respected.
If you need to export more rows than 10 (default), increase the count of rows to be displayed.
The CSV button over the top left of the table allows you to export all data of the query to a .CVS file at once (without pagination).
On this Page:
Overview
Content Tools