The Dashboards are the interfaces where you can inspect the details of processes and services, that have been collected by the Data Collector services.
Accessing the Dashboard UI
You can find the Dashboards home page at http://<your server name>:19902/
You can also use it as an embeded UI in the E2E Bridge Console:
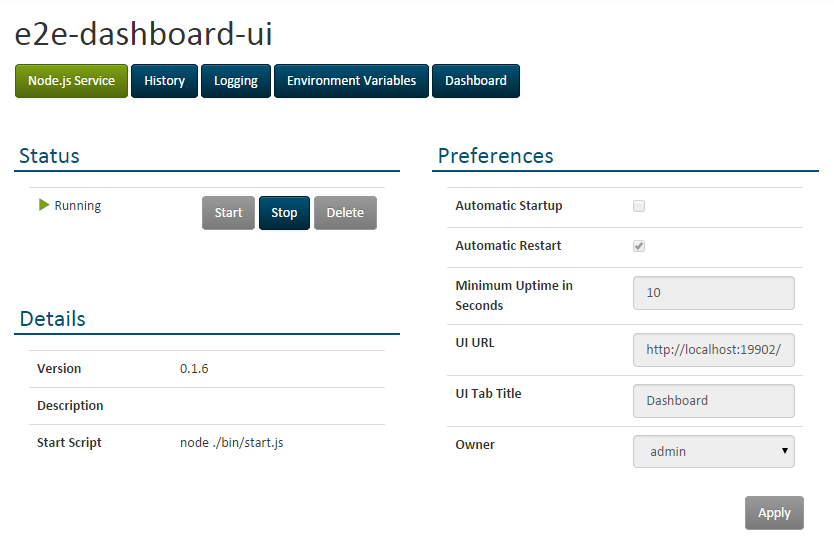
- Open the E2E Console and go to Node.js Services > e2e-dashboard-ui.
- Configure UI URL and UI Tab Title as shown in the screenshot.
- Click on the extra tab Dashboard.
Figure: Accessing the Dashboards User Interface via the E2E Bridge
On this Page:
Overview
Content Tools