Menu "Log File Queue"
The Log File Queue menu contains three sections:
- ETL Process State: In the first window the current state of the ETL service is displayed.
- Log File Queue: The log file queue shows the current import of log files from all services that deliver data to Process Mining.
- Log File Upload: Administration users can also upload log files manually via this window.
Use the Log File Queue menu to monitor the log file import from your services to Process Mining.
Monitoring the ETL Process State
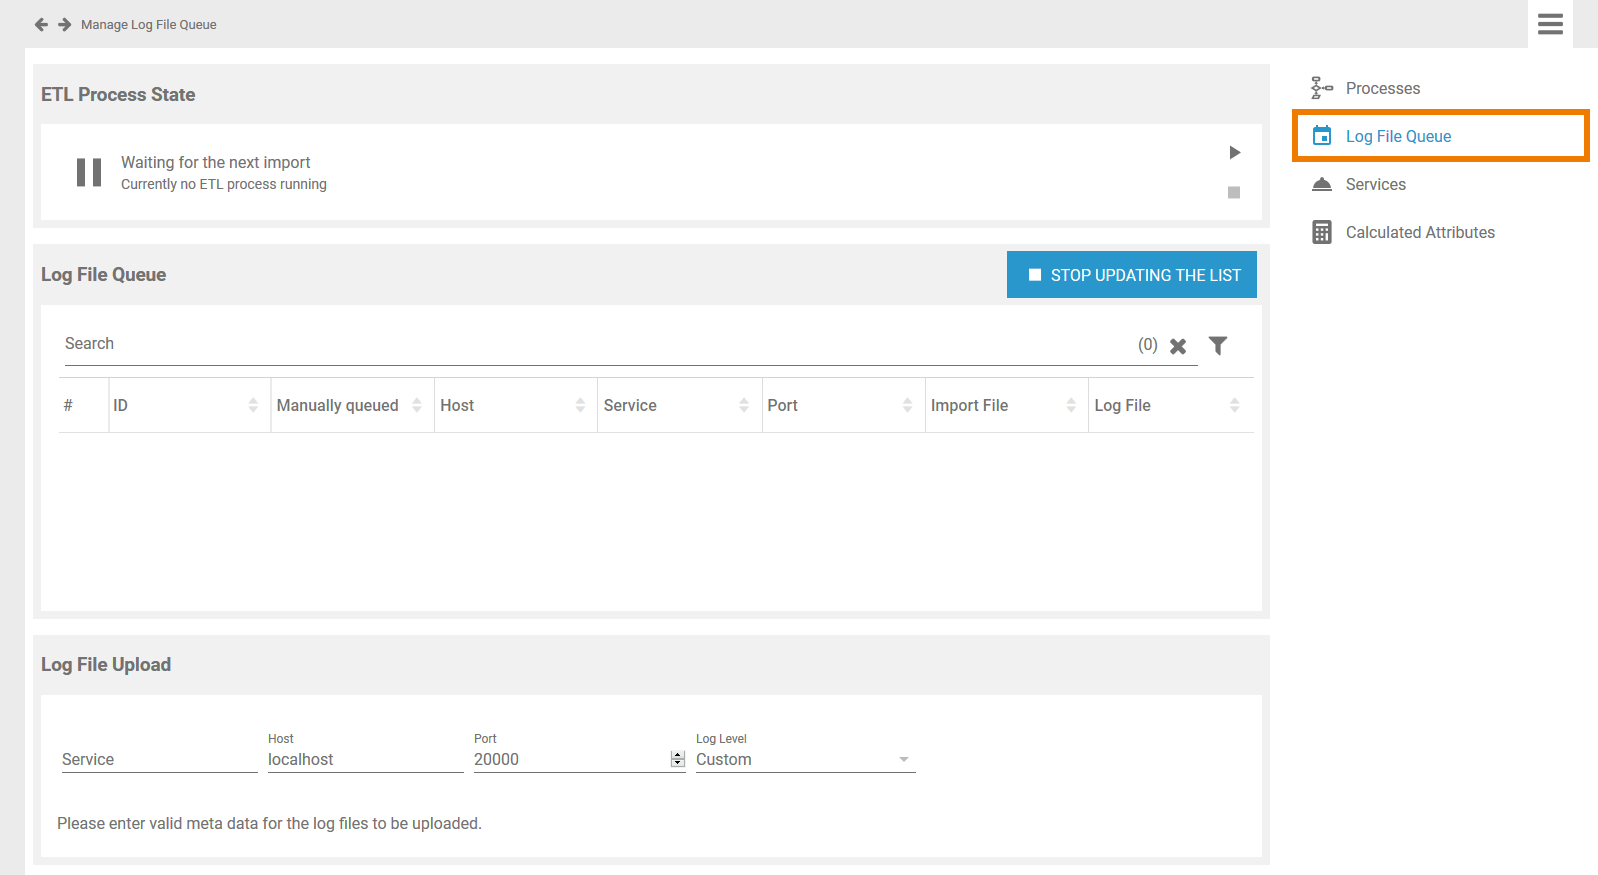
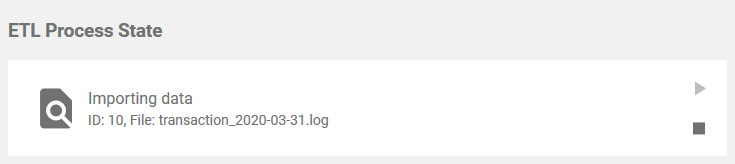
Section ETL Process State shows the current state of the ETL service:
The following states can occur:
| State | Ongoing Action |
|---|---|
| Deleting | The ETL is deleting obsolete data. |
| Importing | Data is currently imported. |
| Loading | Status of the service is requested. |
| Running | The ETL processes the import data. |
| Stopped | The import process is completed. |
| Unavailable | The service is not available. |
| Waiting | The ETL service is waiting for the next import. |
Starting and Stopping the ETL
| In the window ETL Process State administration users have also the option to start and stop the current action of the ETL service.
|
If an error occurs during the import, this import process is terminated with an error. The erroneous import is not discarded to block the start of the next import. This forces the administrator to correct the error or its cause (for example the database down or else).
In case an error occurred, two new buttons will appear in the ETL Process State window:

- Press Retry
 to move the process back to the step where the error occurred. This is useful, for example, if the process encountered the error when deleting old data but the data should definitely be deleted before new data is imported.
 - Press Ignore
 to discard the erroneous import. A new import process is started with the next file waiting to be imported.
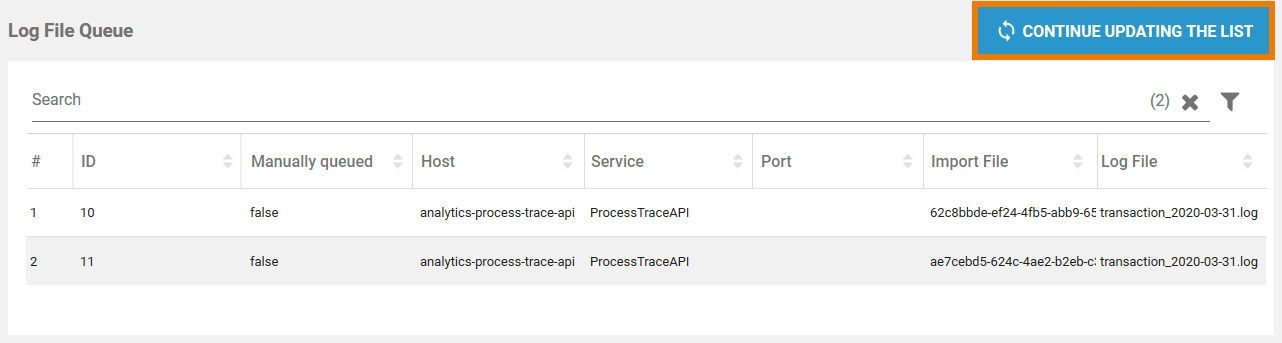
Monitoring the Log File Queue
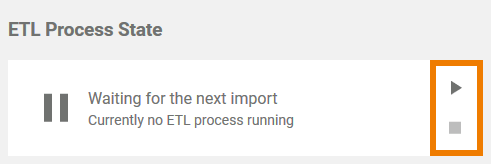
The list of uploaded log files in the Log File Queue section is updated every two seconds:
The following information can be found in the list:
| Column Name | Content |
|---|---|
| # | Number in the current waiting list. |
| ID | Identifier of the import. Specifies the import sequence. |
| Manually queued | Shows whether the upload was triggered manually (true) or automatically (false). |
| Host | Name of the host on which the service is running from which the log data originates. |
| Service | Name of the service that provides the data. |
| Port | Number of the service port. |
Import File | Name of the import file. The import file contains the delta between the original log file and the last import file. |
| Log File | Name of the original log file. The log file contains the complete log data. |
Stopping Automatic Upload
The data is retrieved by the ETL service and is then uploaded to be available for analysis in Process Mining. To avoid processing large numbers of already processed data, only the delta between the original log file and the last import file is uploaded. This keeps the log files to import small and easier to process. As a result, the list in the Log File Queue section can change very quickly, which makes it difficult to filter the list.
The Stop Updating the List button is available to enable administrators to filter the list in a meaningful way. As soon as you pressed this button, automatic updating of the log file queue is stopped. This is also indicated by the new name of the button: Continue Updating the List. Now you are able to filter the list in its current state:
When you are finished, press the button to enable automatic update of the list again.
For further information about the filter options see page Filtering > Filtering the Log File Queue.
Uploading Log Files
If you want to upload log files manually, go to section Log File Upload. This window enables the subsequent upload of old log files, for example if a new system has been set up and you want to use older data then the log files created in the new system.
![]()
First you have to specify the meta data for the upload:
- Service: Insert the name of the service that provided the data.
- Host: Insert the name of the host on which the service was running from which the log data originates.
- Port: Insert the number of the service port.
- Log Level: Select the desired log level. Your options are Custom, Service and IO.
The different log levels are explained in detail on page Transaction Log Levels of an xUML Service in the BRIDGE Integration Platform User's Guide.
Only when you have entered the meta data completely, the upload field is displayed:
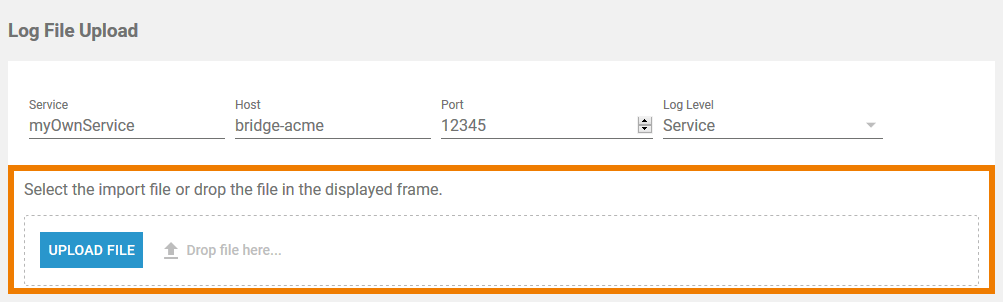
You have two options to upload the import file:
- Use drag and drop to place your document to the space marked Drop file here.
- Click the Upload File button to select your file.
The supported format is .zip. Make sure that the zip file contains only the .log files to be imported without any directory structure.
Once the file has been dropped, the upload starts automatically.
On this Page:
Related Pages:
Overview
Content Tools