
The E2E Builder allows you to test all operations of a service at runtime in a model based fashion. You can not only test and trace synchronous calls to a service but also asynchronous threads, for instance such of time triggered events or asynchronous tasks of a persistent state engine.
The Builder provides different ways of how to test and trace a service. One possibility is to record the execution path of a service call. The E2E Analyzer can request the recorded trace information from the server and display the information graphically as UML sequence and activity diagrams. The execution path and all runtime values can be analyzed by the user.
Another possibility is to debug the models at runtime. The E2E Interactive Debugger allows you to set breakpoints in the activity diagrams of the UML models. You can step directly into each action of an activity diagram within MagicDraw and examine the executed action script and runtime values of all objects.
In lesson 1, the E2E Interactive Debugger is introduced. The E2E Analyzer will be subject of lesson 2 and 3.
Running the Service
You will now test the Web service.
First of all, you will start the service, run a test case, and check the response the service returns. After that, you will debug the service step by step.
| On the left side of the EducationLesson1 node the little gear wheel icon shows whether the service has been started or not. E2E Builder contains an Embedded Runtime, to which the xUML service repository gets deployed automatically whenever you start the service. |
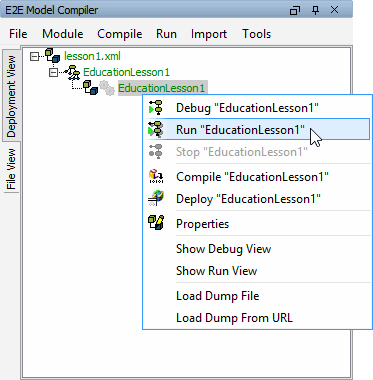
Currently, the gear wheel is gray ![]() , because the service is stopped. Click the deployment EducationLesson1 with the right mouse button and select Run "EducationLesson1" from the context menu.
, because the service is stopped. Click the deployment EducationLesson1 with the right mouse button and select Run "EducationLesson1" from the context menu.
Another window opens that contains several tabs to administrate and test the service. This window is called the Runtime window. We recommend placing the Runtime window as additional tab next to the E2E Messages tab. If it has been placed at the bottom of the MagicDraw window, you should reorganize the window layout.
First, make sure the message window is opened (shortcut Ctrl - Shift - M).
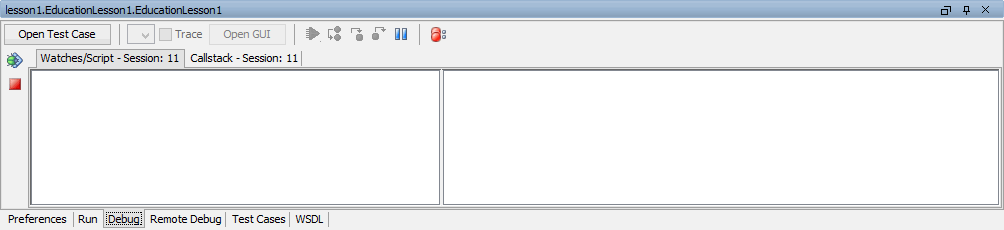
Then, click the tab labeled with lesson1.EducationLesson1. EducationLesson1 as shown in the picture below. Drag it...
.. over the title bar of the message window and release the mouse button as soon as the message window is surrounded by a blue border.
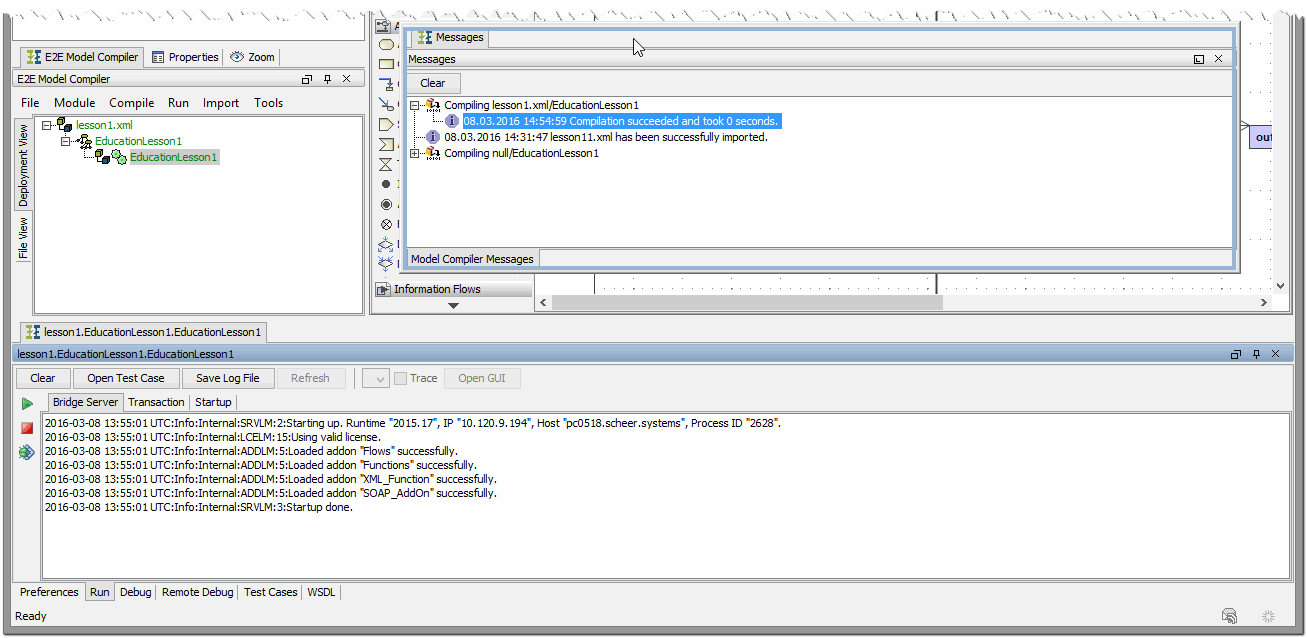
The message window and the window lesson1.EducationLesson1. EducationLesson1 have been merged. You can now drag & drop the merged window wherever you like, a blue frame indicates where it can be fixed in the MagicDraw window:
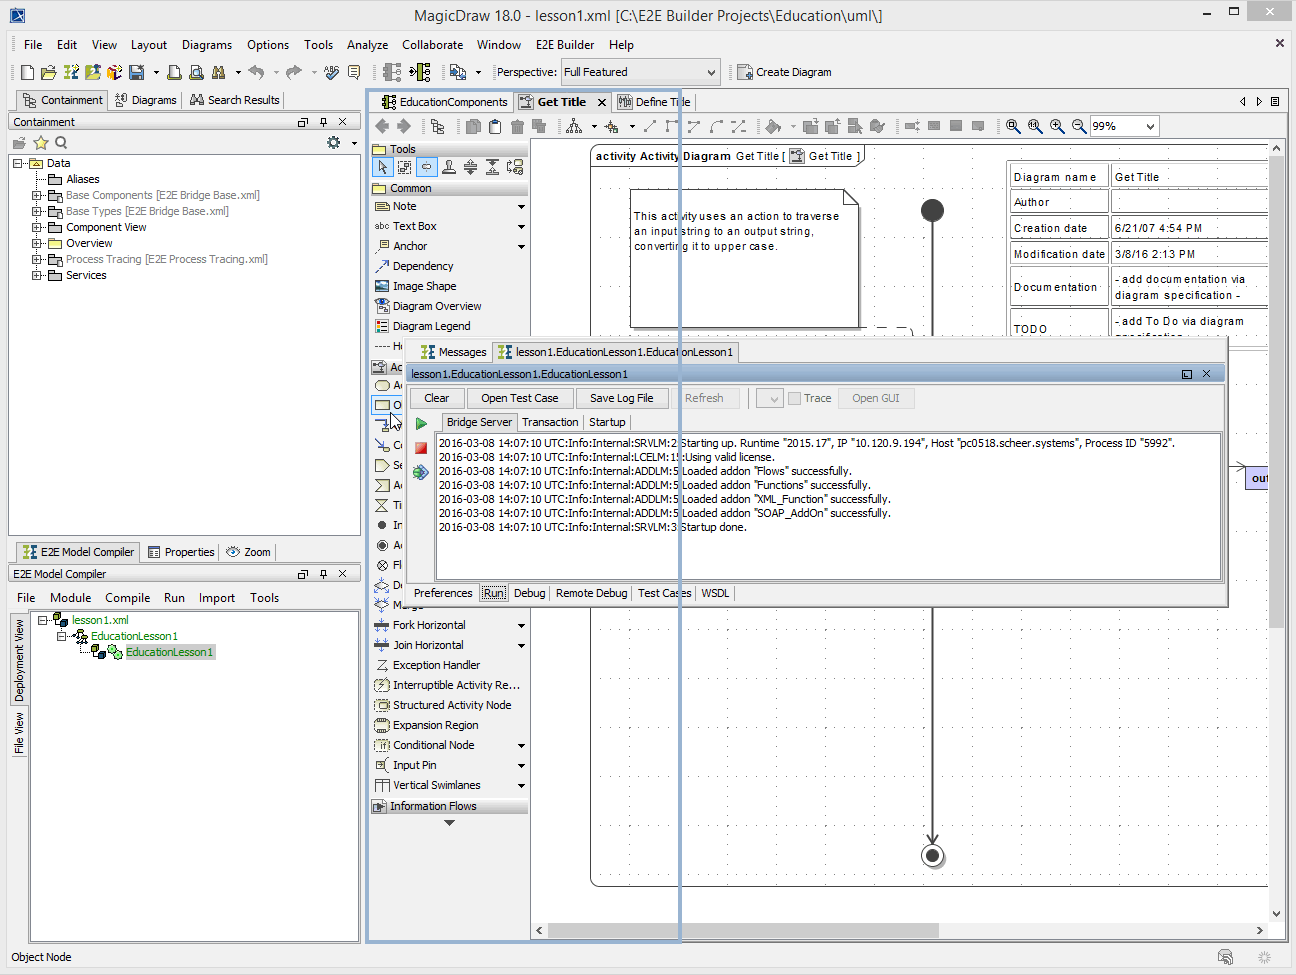
The window layout is stored individually for each model.
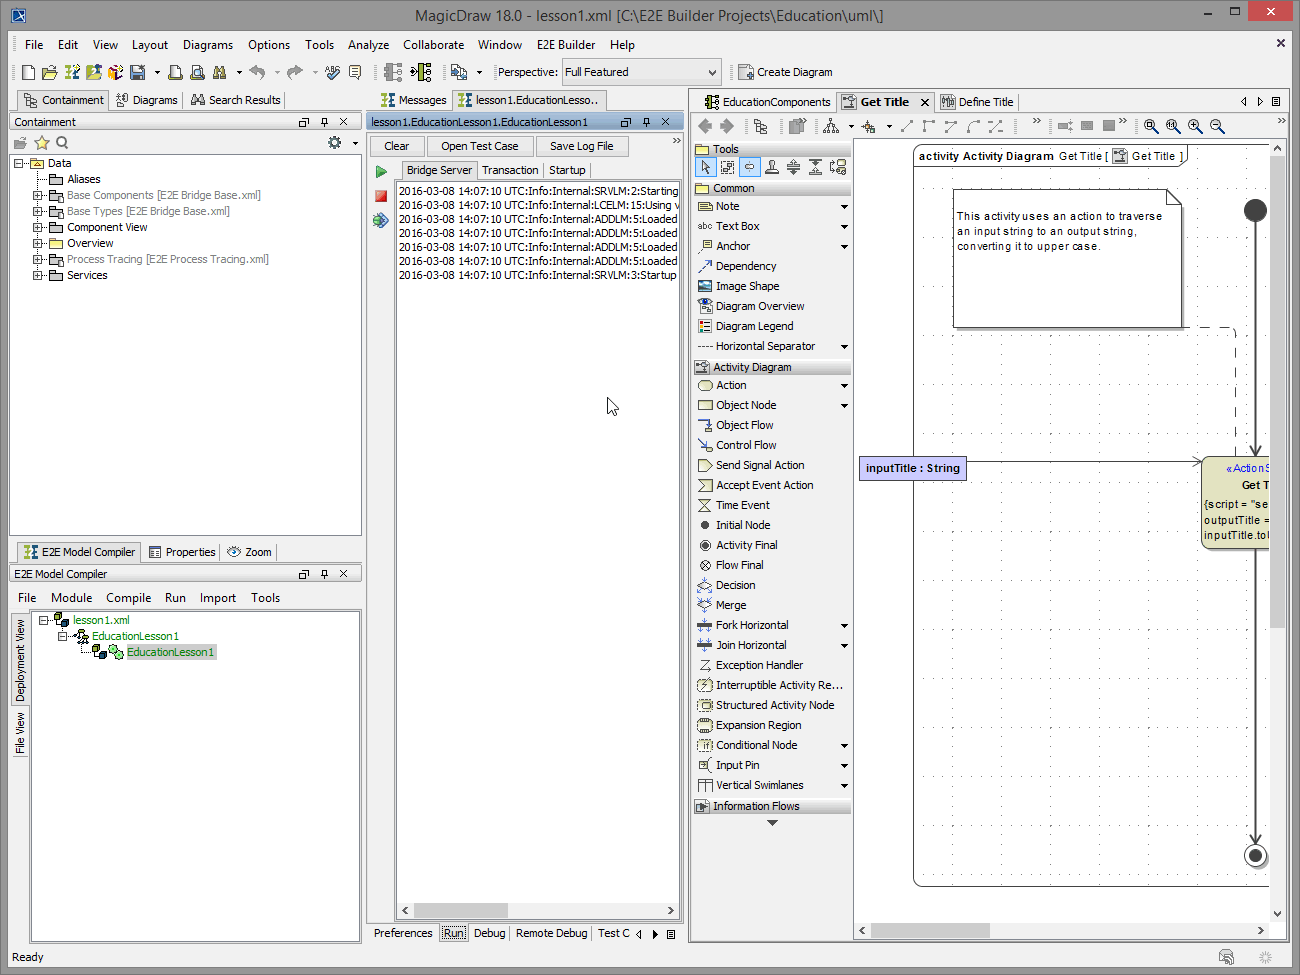
The Runtime window contains six tabs: Preferences, Run, Debug, Remote Debug, Test Cases and WSDL.
- In the Preferences tab, the settings of the service (particularly the settings defined in the model) can be edited.
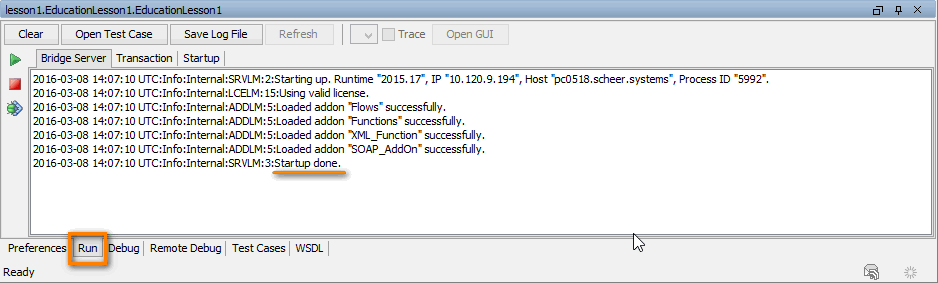
- The Run tab serves to start and stop the service and to view the service log.
- The Debug and Remote Debug tab contain debugging functionality.
- In the Test Cases tab, test cases can be specified and run.
- The WSDL tab contains the generatet WSDL to share the service.
You will use the Debug tab as well as the Test Cases tab in the following testing steps. For further information on the Runtime window refer to the BUILDER User's Guide.
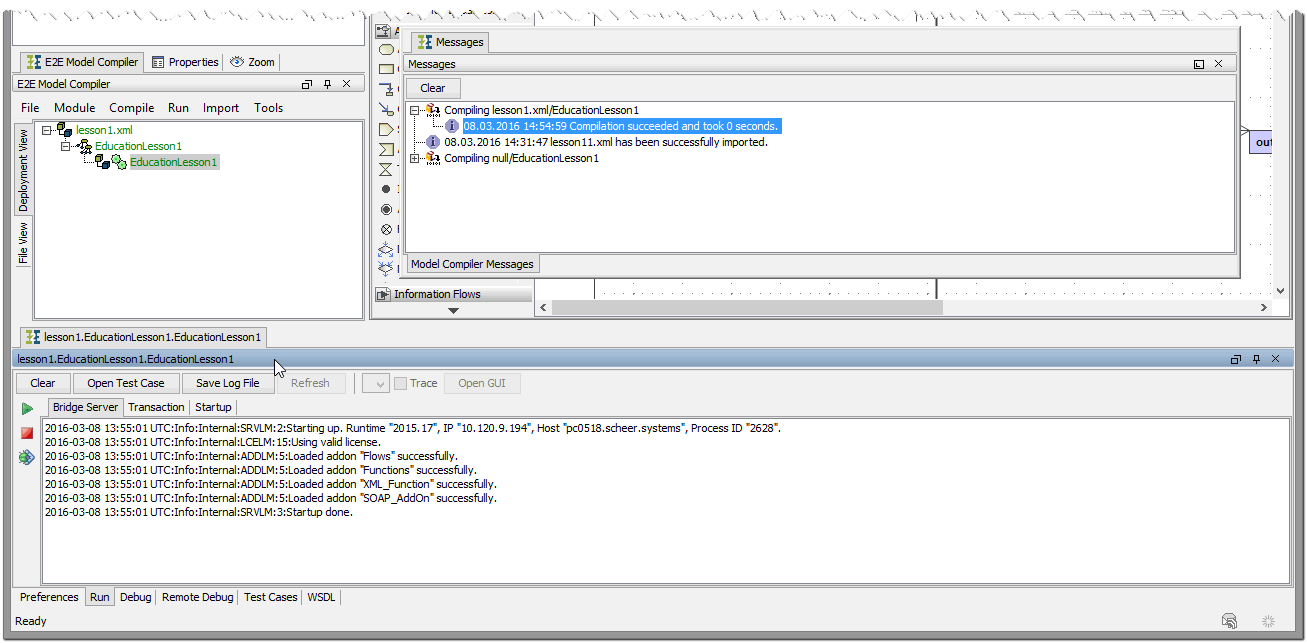
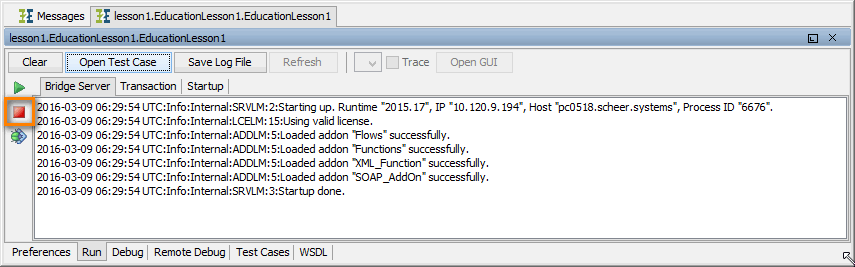
As you started the service, the Run tab has been opened. It shows all messages of the start up procedure of the service. If the service start up has been successful, the last line reads Start up done.
In summary, the following tasks have been executed automatically after clicking Run in the Model Compiler:
- If the model had been changed, it would have been compiled as well.
- The service composite has been deployed to the E2E Embedded Runtime.
- The service has been started spawning a Bridge process.
The service is ready to process service SOAP requests. Using the Embedded Runtime, the service will always be deployed to localhost.
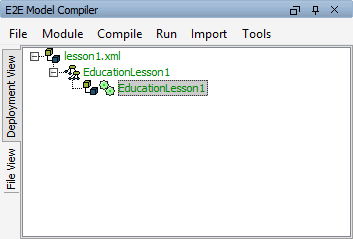
| Note, that the gear wheal in the Model Compiler has turned green |
Running a Test Case
In the next step, you will run a test case and check the response the service returns.
In the Runtime window click Open Test Case.
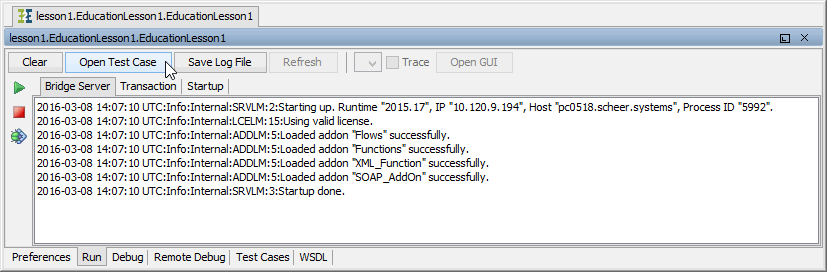
The Runtime window switches from tab Run to tab Test Cases, which contains the E2E SOAP Test Tool. With this tool, you can edit SOAP requests of defined test cases that will be sent to the service. The returned SOAP responses can be viewed as well.
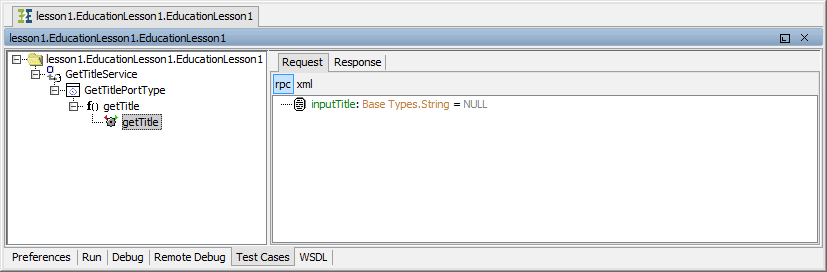
On the left panel, you find a tree with entries representing the WSDL definition of the service. On the right panel, you will find the SOAP requests and SOAP responses of selected test cases.
| The following items are displayed for each WSDL definition:
|
When you start a service in the Embedded Runtime, the SOAP Test Tool imports the WSDL from the service repository and creates a test case automatically. The SOAP requests and responses will be stored with the test case on disk, so they are not lost when you close MagicDraw.
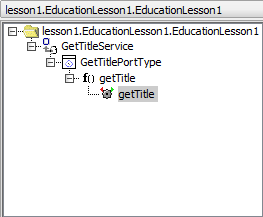
The test case getTitle has been created automatically and is displayed next to a gearwheel ![]() . The gearwheel in gray color indicates that this test case has not yet been run.
. The gearwheel in gray color indicates that this test case has not yet been run.
The SOAP Test Tool contains a Request and a Response tab in the right panel of the window. Now, define the request that should be sent to the service.
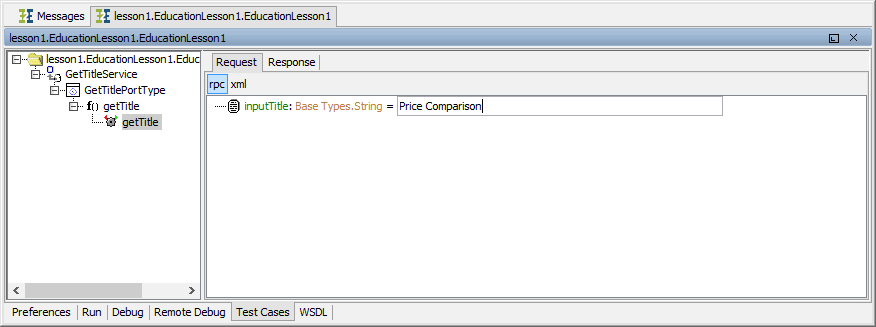
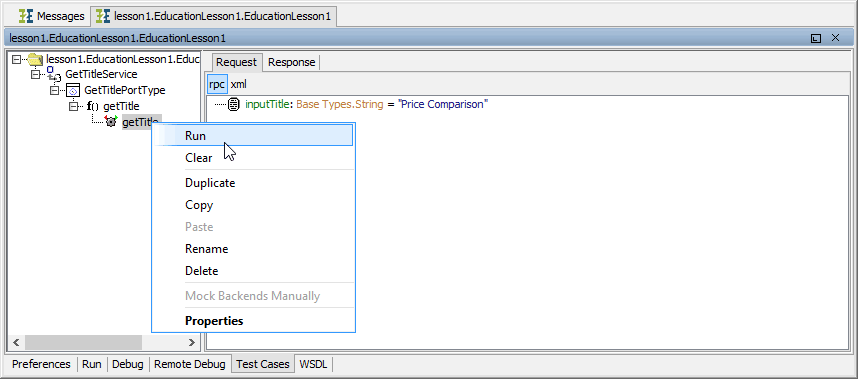
In the Request tab, click inputTitle a first time to select it, and a second time to edit it. Enter an input string as shown in the picture below and press Enter. The string object inputTitle is the input parameter of the operation getTitle as defined for the port type and implemented in the activity diagram.
Click the test case getTitle with the right mouse button and select Run.
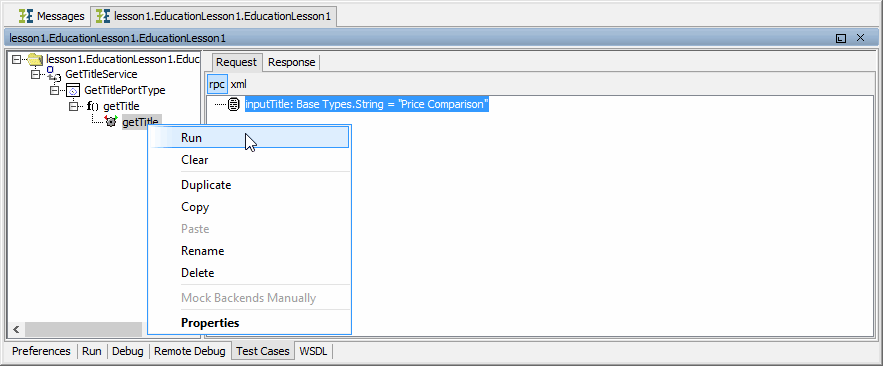
Running a test case means that the SOAP Test Tool sends a SOAP request containing the defined input data to the service hosted by the Embedded Runtime.
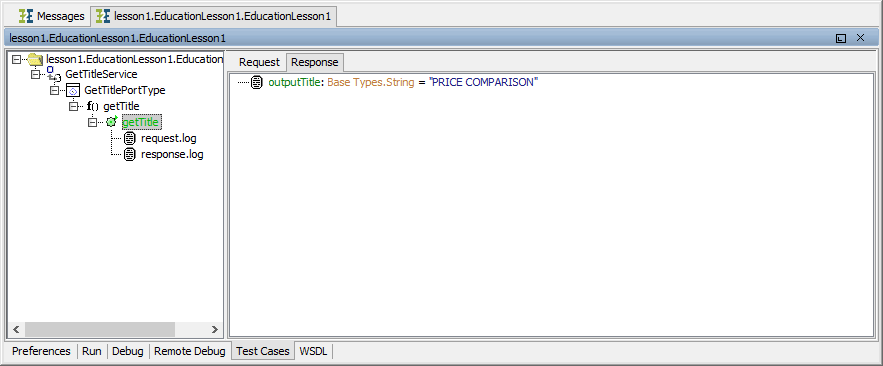
After successful execution of the test case, the gearwheel color changes to green. The SOAP Test Tool switches to the Response tab and shows the results. The input title has been returned in uppercase.
If the gearwheel is displayed in red, a runtime error has occurred.
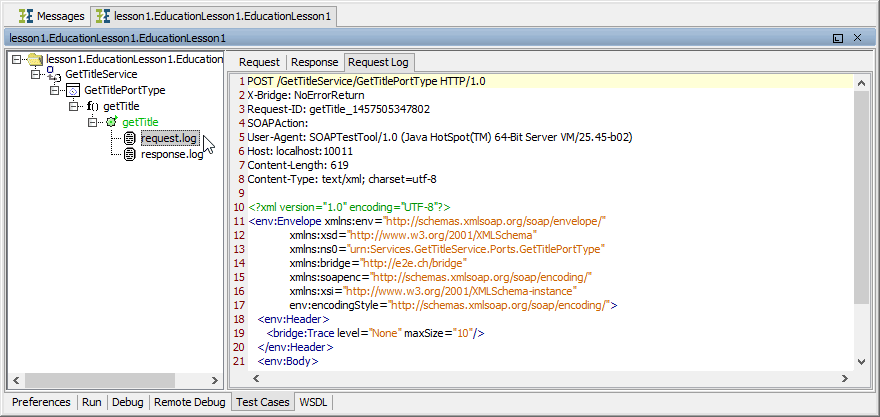
Two new tree entries below the test case getTitle are displayed. They represent the request and response logs containing the SOAP messages the SOAP Test Tool sent and received.
When clicking the entry request.log in the tree, an additional tab Request Log opens and displays the request SOAP message that has been sent to the Web service.
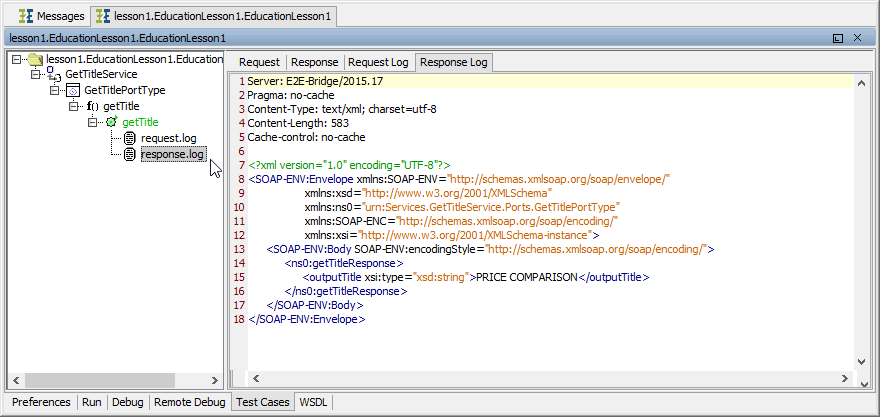
When clicking the entry response.log, the Response tab opens and displays the result that the Web service has returned to the SOAP Test Tool.
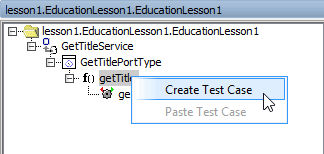
It is also possible to create multiple test cases for a single operation. Each test case can be run with individual input values.
| Further test cases can be created by selecting Create Test Case from the context menu of the operation getTitle. |
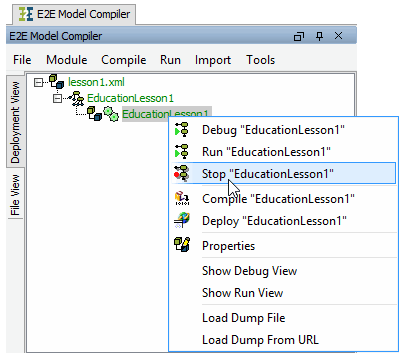
Now stop the service running in the Embedded Runtime. This will stop the corresponding Bridge server process.
You can do this in two ways:
Either switch to the Run tab in the Runtime window and click the stop icon ![]() ...
...
| ... or stop the service by selecting Stop "EducationLesson1" in the context menu of the deployment in the Model Compiler. This can also be done in the Model Compiler menu Run if the deployment is selected. |
After stopping the service the gearwheel in the Model Compiler window turns gray again.
For more information on how to work with the Test Cases View refer to the Builder User's Guide.
Debugging the Service
In this chapter, you will learn how to debug a service. The E2E Builder provides the E2E Interactive Debugger, which allows you to debug a service step by step by setting breakpoints in the activity diagrams of UML models. You can step directly into each action of an activity diagram within MagicDraw and examine the executed action script and runtime values of all objects.
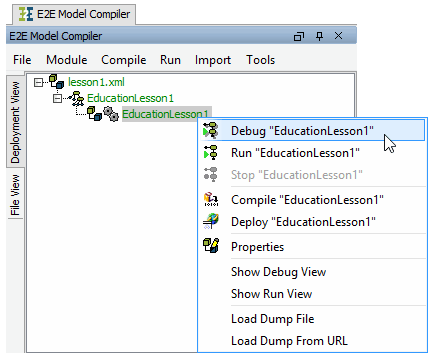
For debugging purposes, the service has to be started in debug mode.
| Select the deployment of your service in the Model Compiler and choose Debug "EducationLesson1" from the context menu. |
After the Runtime window showed the service starting up, the Debug tab is displayed and the service is ready to be debugged. Clicking ![]() will stop the service at any time, clicking
will stop the service at any time, clicking ![]() will restart it in debug mode again.
will restart it in debug mode again.
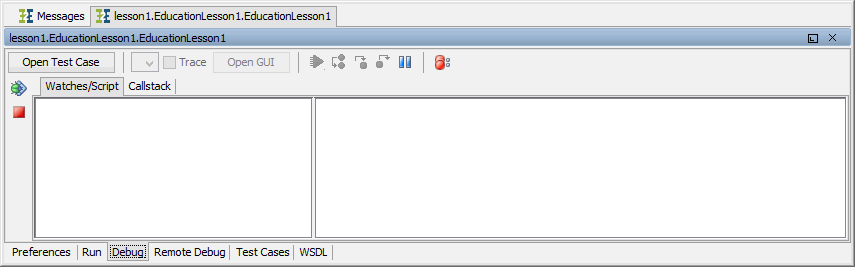
Usually, you define a breakpoint on an action node in the activity diagram and start the test case in order to debug the service. Then, you can step through the activities, look at object values, and trace errors.
Additionally, you can use the pause mode by clicking the pause button ![]() . The interactive debugger will pause the service at the next possible point: if the test case has not been started yet, this means the very first action of the service. If the service is already processing the request of the test case, clicking pause will lead to the service being paused at the next possible action. This is especially useful, if the service is trapped in an endless loop.
. The interactive debugger will pause the service at the next possible point: if the test case has not been started yet, this means the very first action of the service. If the service is already processing the request of the test case, clicking pause will lead to the service being paused at the next possible action. This is especially useful, if the service is trapped in an endless loop.
You will now set a breakpoint in the activity diagram of your service. The interactive debugger will stop at the action where you have set the breakpoint.
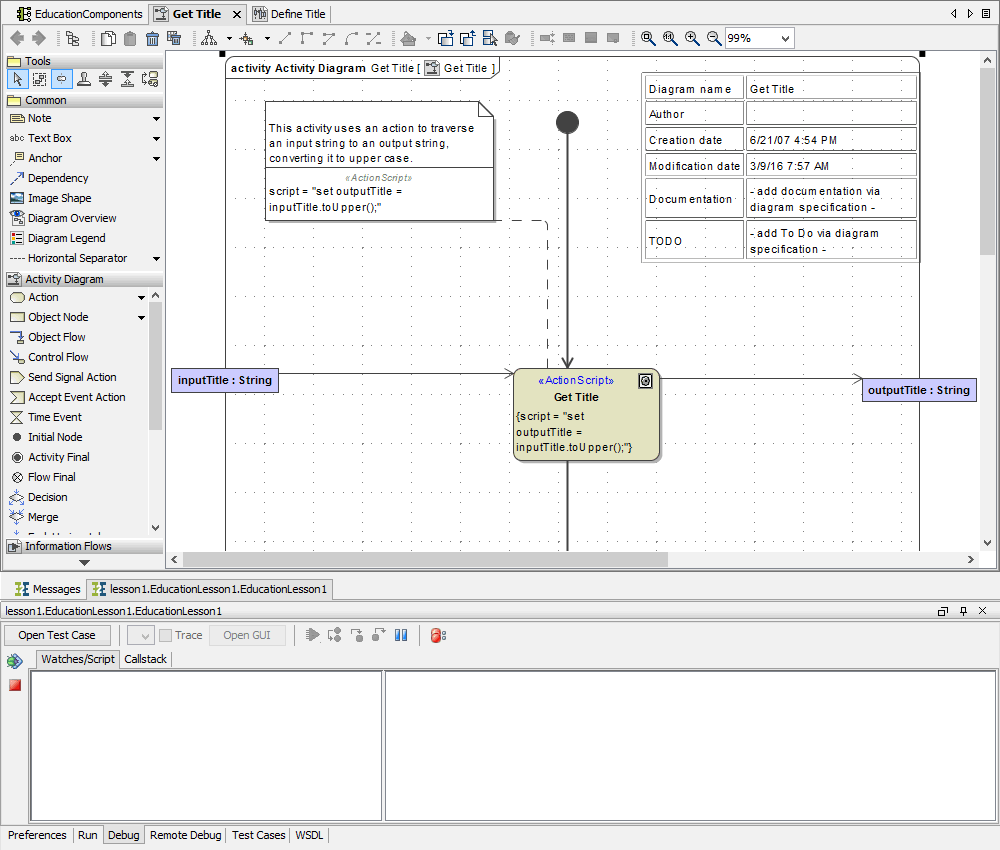
In the diagram pane switch to diagram Get Title.
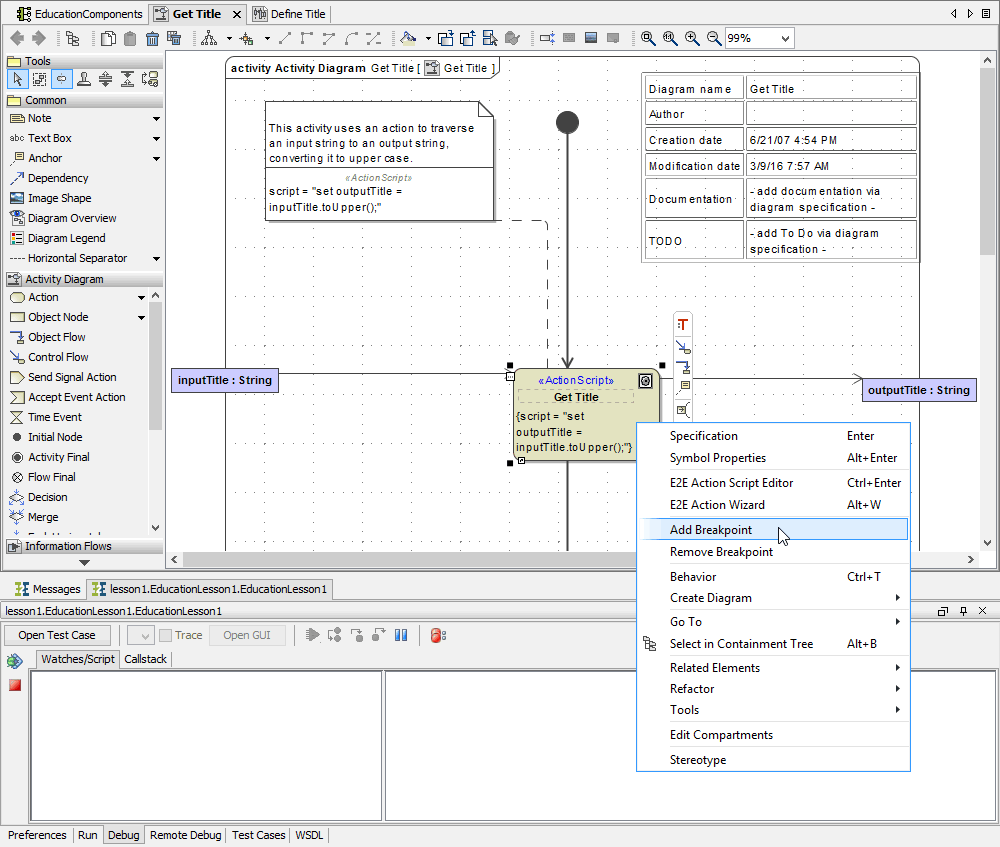
Right-click the action node Get Title and select Add Breakpoint from the context menu.
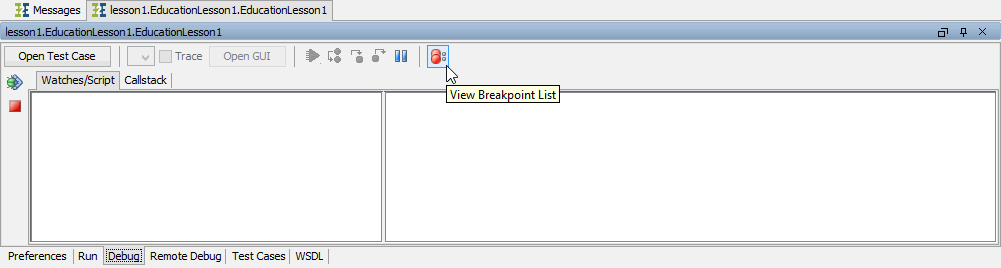
Click ![]() in the Interactive Debugger toolbar to view all breakpoints that are set in the UML model.
in the Interactive Debugger toolbar to view all breakpoints that are set in the UML model.
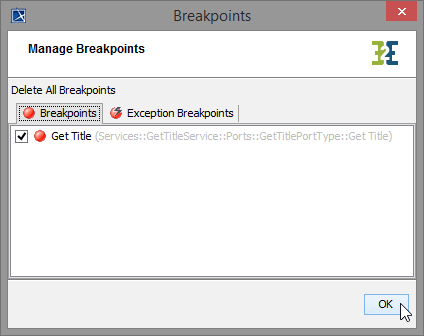
| The Manage Breakpoints dialog displays a list of all breakpoints. The check box in front of each breakpoint indicates wether the breakpoint is active or not. |
Now, you need to start the test case in order to debug the service. Switch to the Test Cases tab, e.g. by clicking the button Open Test Case in the toolbar and run the test case.
The Runtime window switches back to the Debug tab and shows the service being stopped at the first breakpoint. The debug tab shines yellow and the action node, the breakpoint was added to, is marked in yellow in the activity diagram.
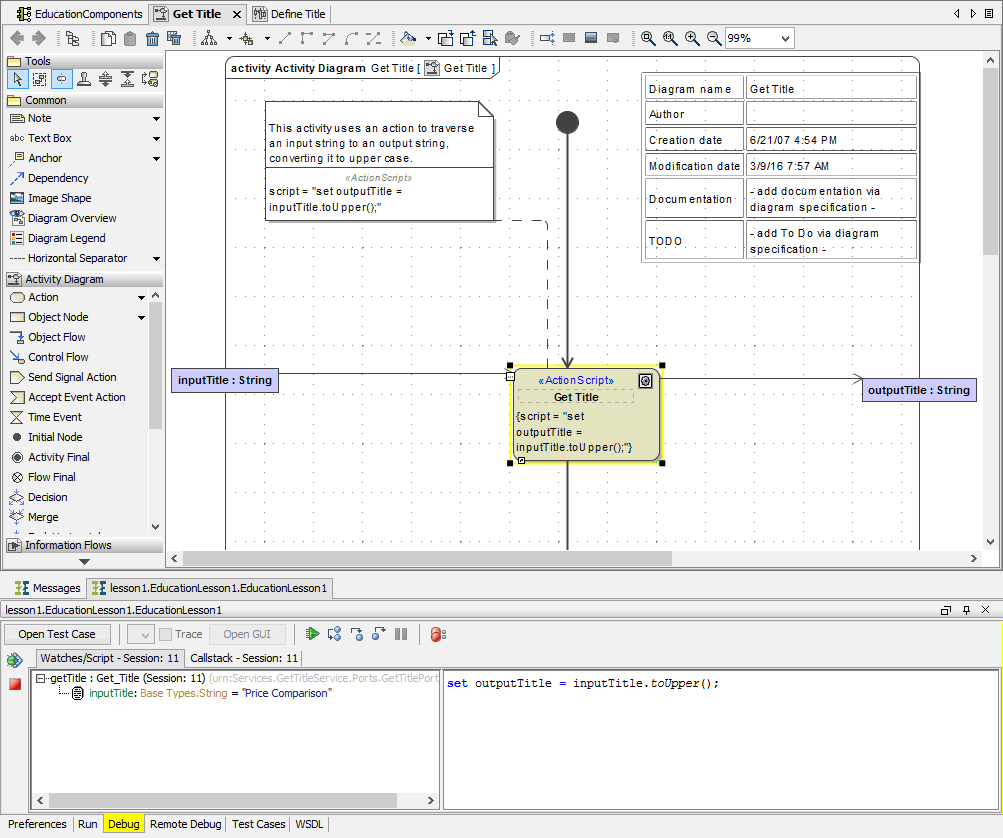
The Watches/Script tab of the Interactive Debugger has two panels.
- In the left panel, the operation currently being processed (getTitle()) is displayed. The interactive debugger stopped in the implementation (activity diagram) of this operation. It stopped at the action node, where the breakpoint has been set (in the first line of the left panel it reads Get_Title. Blanks in the action node name were replaced by an underscore "_"). Below this action, its input and output parameters are displayed. Currently, the input string inputTitle having the value Price Comparison is shown.
- In the right panel, the action script statements of the current action are displayed. Currently, this is the set assignment statement set outputTitle = inputTitle.toUpper();
The Interactive Debugger offers you the following possibilities to proceed:
| Icon | Action | Description |
|---|---|---|
| Step into the action. | The Interactive Debugger steps into the action and stops directly before executing the next action script statement. | |
| Step over the actual action and continue with the next action. | The Interactive Debugger executes all remaining action script statements of the current action and stops at the beginning of the next action. | |
| Go up the call stack to the calling action. | The Interactive Debugger executes all remaining actions of this activity diagram and returns to the calling activity. It stops at the next action of this activity diagram. | |
| Go to the next breakpoint. | The Interactive Debugger continues the execution of the model until it is stops at the next breakpoint. |
In order to debug the action script of the current action, click ![]() Step Into.
Step Into.
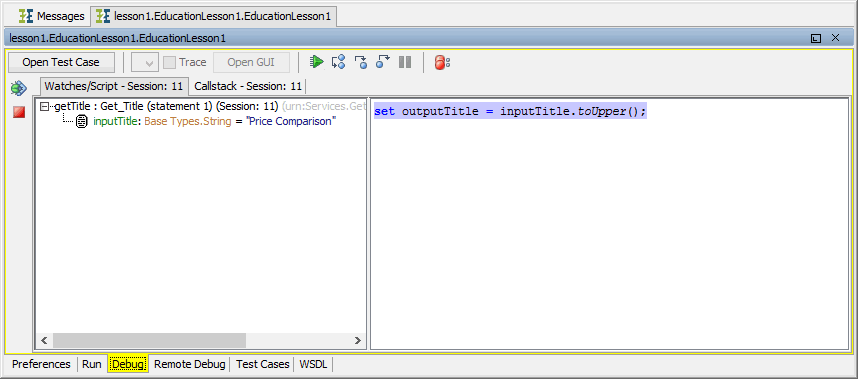
Note, that in the right Script panel of the window the action script statement got highlighted. The Interactive Debugger will execute the statement if you step into it.
Click ![]() Step Into once again.
Step Into once again.
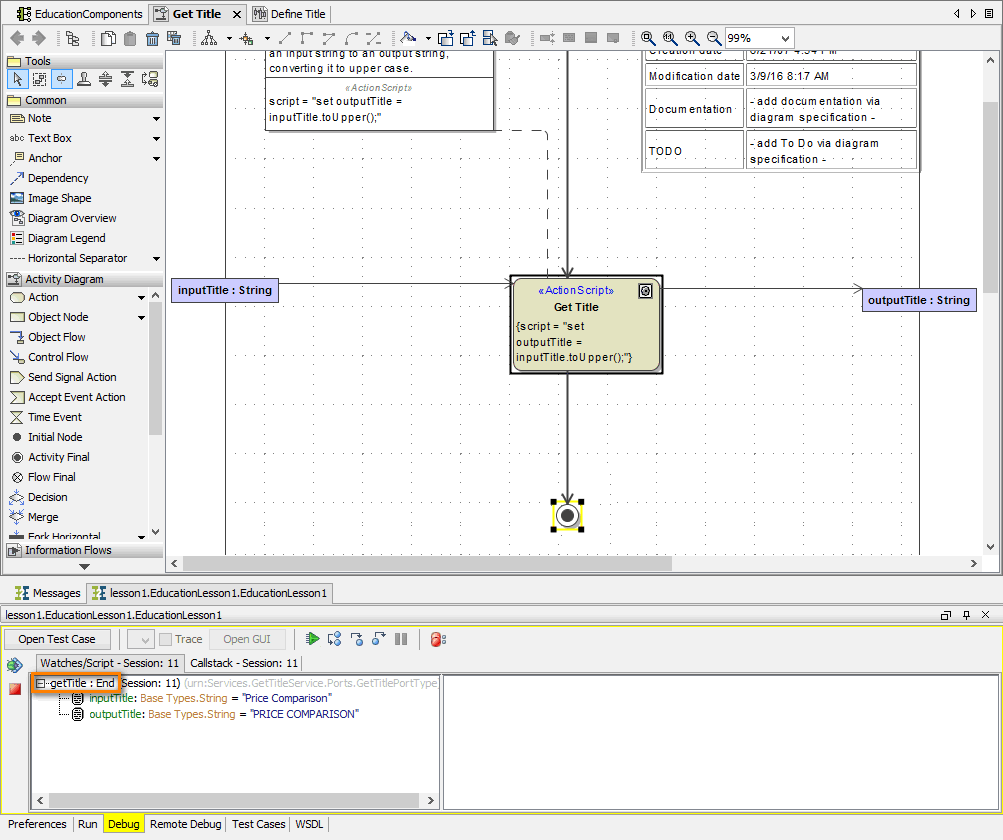
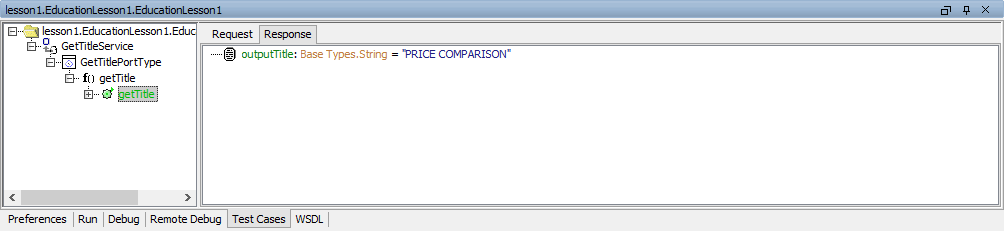
The Interactive Debugger executed the action script statement and has stopped at the activity final node End. This is indicated in the first line of the Watches panel (getTitle:End).
The set statement has been processed and disappeared. In addition to the input parameter inputTitle, the Watches pane shows the result of the action script execution, the output parameter outputTitle having the value PRICE COMPARISON.
Click ![]() Go To Next Breakpoint. As there are no further breakpoints defined, the test case will run to its end.
Go To Next Breakpoint. As there are no further breakpoints defined, the test case will run to its end.
Switch back to the tab Test Cases.
The Response tab shows the result of the request. The gearwheel is still green as during debugging no error occurred.
All breakpoints are stored within the Builder project. Debugging the service in another session, all breakpoints are still set.
For more information on how to debug a service refer to the Builder User's Guide.

On this Page:
Overview
Content Tools