The Service Dashboard is the interface where you can inspect the more technical details of a service, that have been collected by the Data Collector services. The collected data is presented in table form or in chart form.
The Elements of the Service Dashboard UI explained
Figure: User Interface of the Service Dashboard
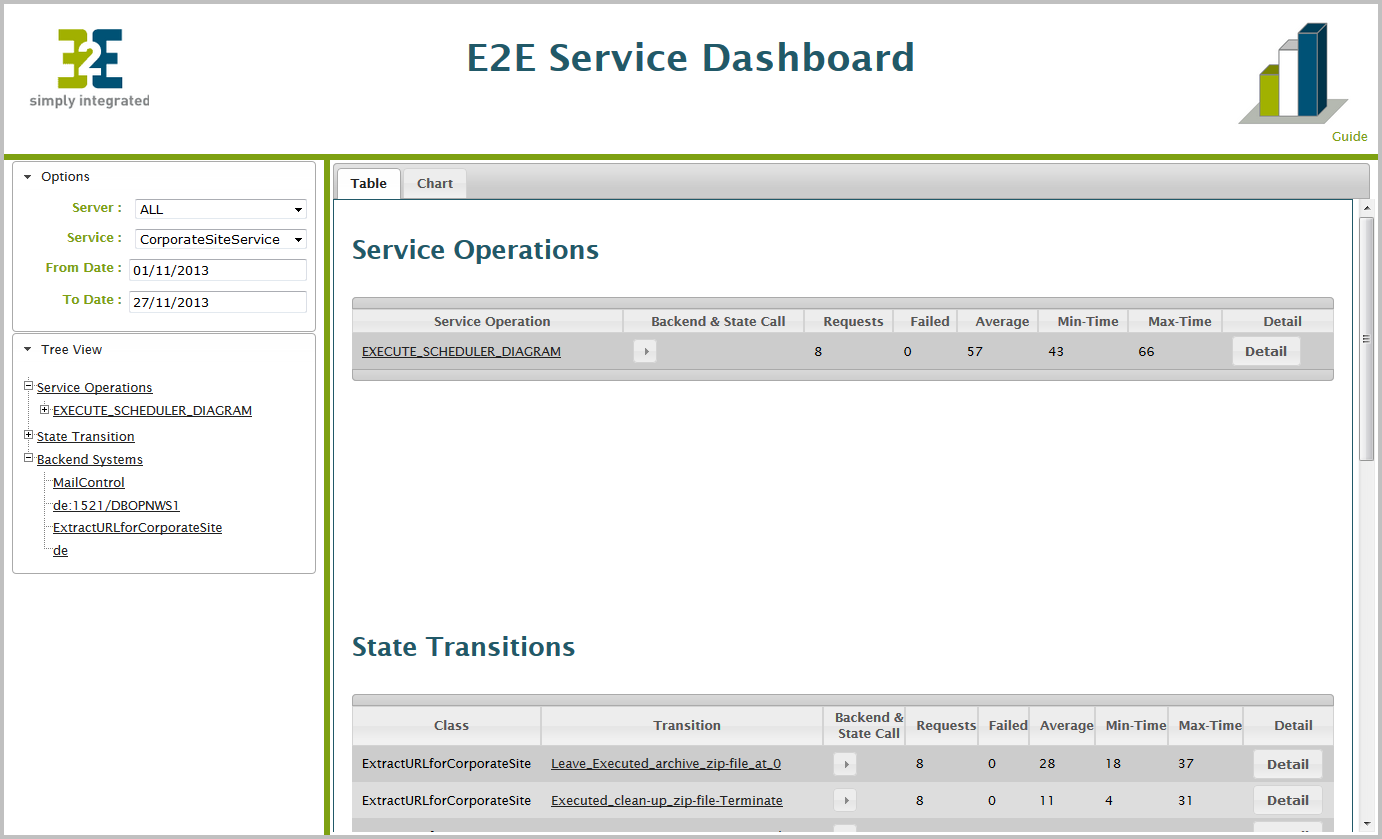
The Service Dashboard UI consists of two areas:
- a navigation area on the left (consisting of the elements Options and Tree View)
Via the elements of the navigation area, you can narrow down the information shown in the data area on the right. - a data area on the right (consisting of the tabs Table and Chart).
The data area displays the collected service data as selected from the navigation area.
The Navigation Area
Options
Via the Options, you can delimit the information shown in the data area.
| Option | Description |
|---|---|
| Server | You can run the Data Collector service on multiple E2E Bridges and store the collected information in the same database. In this option, select the E2E Bridge of whom you want to inspect the collected data. |
| Service | Select the service of whom you want to inspect the collected data. |
| From Date, To Date | Specify a date range within the collected data. |
Tree View
The Tree View is divided into three parts:
- Service Operations
- State Transitions
- Backend Systems
Below the tree nodes, you will find a list of all service operations, state transitions and backend systems of the selected service. You can access more information on the elements by clicking them. This will open the Chart view of the selected element.
Vice versa, the tree view will expand to the selected element, when you browse through the data in the data area.
The Data Area
The data area shows information related to the service you selected in the Options. At the top of the data area, you can switch between a Table or a Chart view.
For more information on the data presented in the data area refer to Using the Table View and Using the Chart View.
On this Page:
Related Pages:
Overview
Content Tools