The Table View presents the collected data in a tabular way.
It is divided into three parts:
- Service Operations
- State Transitions
- Backend Systems
Service Operations
The table Service Operations lists all service operations of the selected service that have been called in the selected period of time.
Figure: Tabular Overview on the Service Operation Requests
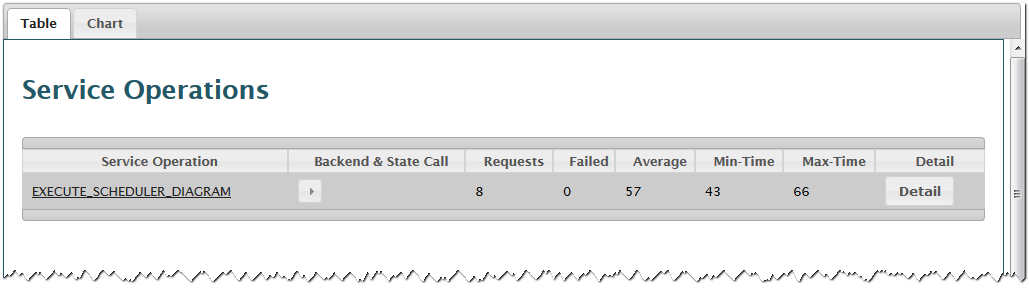
As you can see in the picture above, the service operation EXECUTE_SCHEDULER_DIAGRAM has been called 8 times. None of the 8 service calls have failed. The average response time of the service operations has been 57 milliseconds (minimum: 43 ms, maximum: 66 ms).
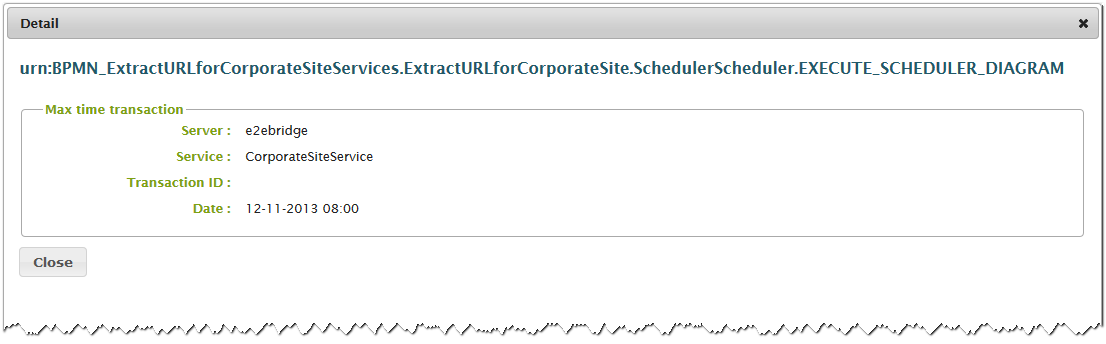 | By clicking the Detail button in the table column labelled Details, you can display some details on the request of selected service operation that took the longest time. |
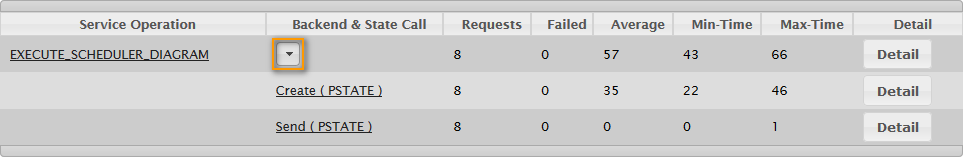 | By clicking the arrow button in column Backend & State Call, you can toggle some more backend and persistent state information on this service operation. You can switch to the chart view of a selected backend or persistent state by clicking it's name.The information that is presented by the chart view is described in more detail in Using the Chart View. |
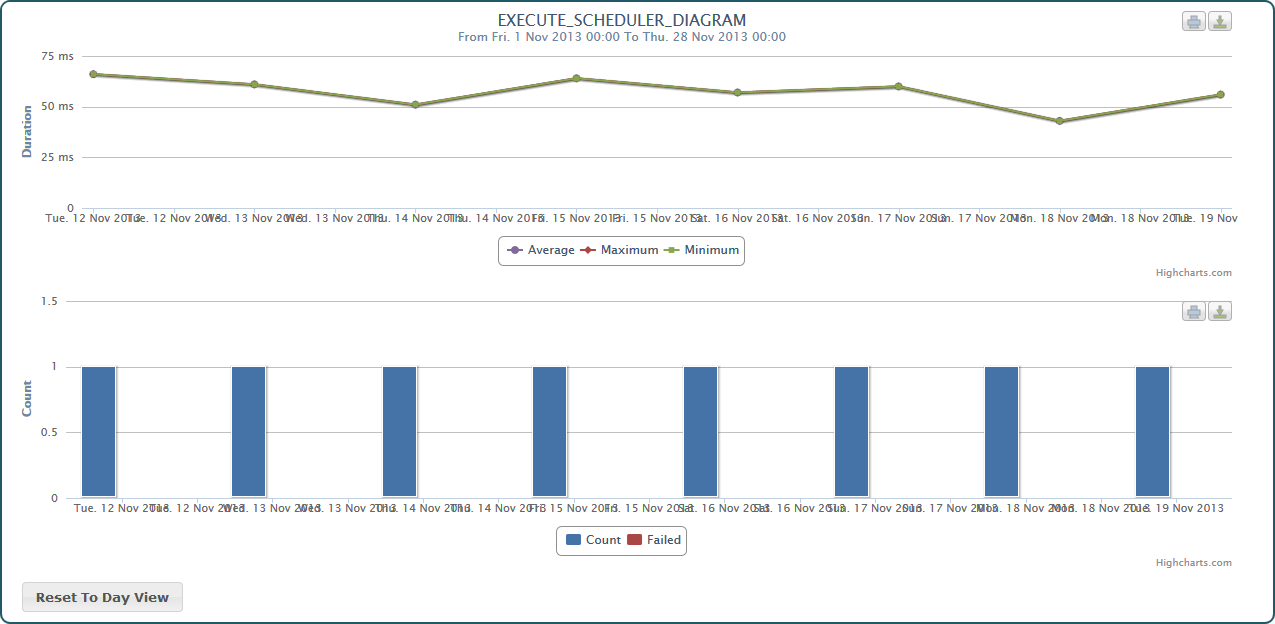 | By clicking the name of the service operation, you can switch to the chart view of this operation. The information that is presented by the chart view is described in more detail in Using the Chart View. |
State Transitions
The table State Transitions lists all state transitions of the selected service per class and transition that have been done in the selected period of time.
Figure: Tabular Overview on the State Transitions
![]()
As you can see in the picture above, e.g class ExtractURLforCorporateSite has been undergone state transition Leave_Executed_archive_zip-file_at_0 8 times. None of the 8 transitions have failed. The average transition time has been 28 milliseconds (minimum: 37 ms, maximum: 18 ms).
| By clicking the Detail button in the table column labelled Details, you can display some details on the transition that took the longest time. | |
By clicking the arrow button in column Backend & State Call, you can toggle some more backend and persistent state information on this transition. You can switch to the chart view of a selected backend or persistent state by clicking it's name.The information that is presented by the chart view is described in more detail in Using the Chart View. | |
By clicking the name of the transition, you can switch to the chart view of this transition. The information that is presented by the chart view is described in more detail in Using the Chart View. |
Backend Systems
The table Backend Systems lists all backends that have been called in the selected period of time.
Figure: Tabular Overview on the Backend System Requests
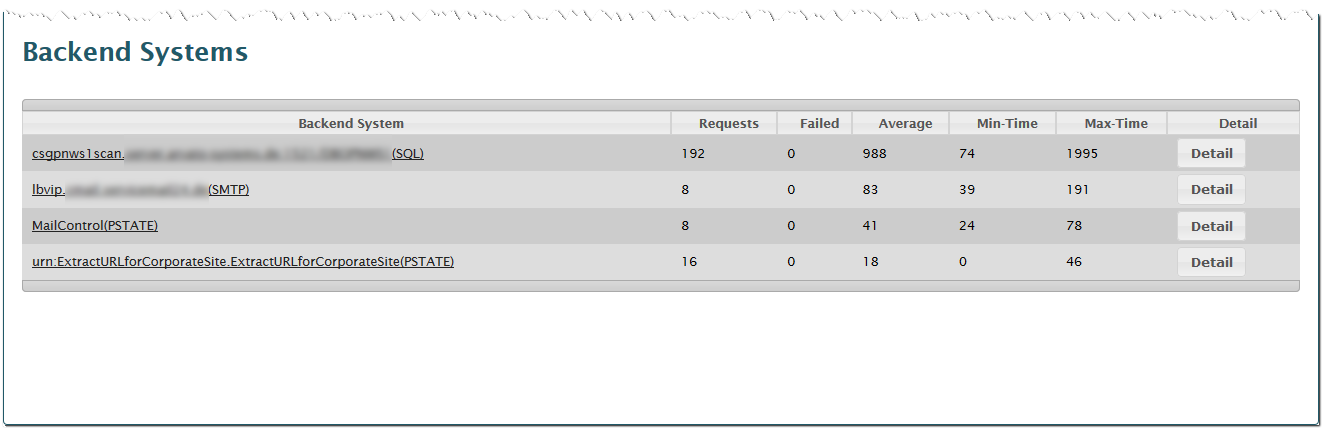
As you can see in the picture above, e.g the SQL server csgpnws1 has been requested 192 times. None of the 192 requests have failed. The average response time has been 988 milliseconds (minimum: 71 ms, maximum: 1995 ms).
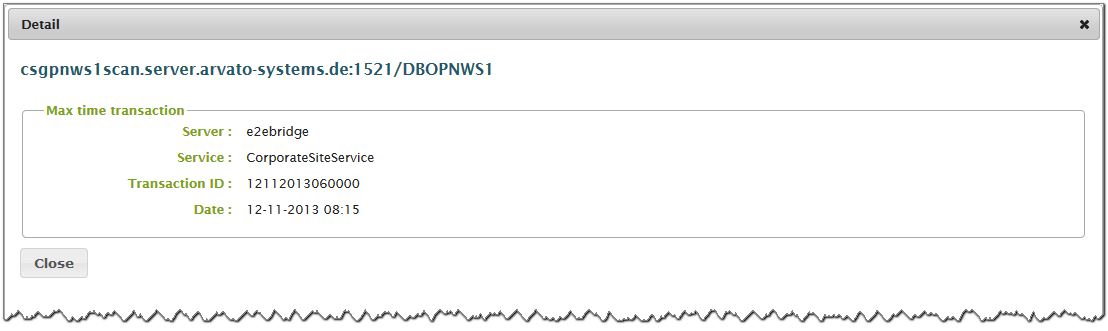 | By clicking the Detail button in the table column labelled Details, you can display some details on the backend call of the selected backend that took the longest time. |
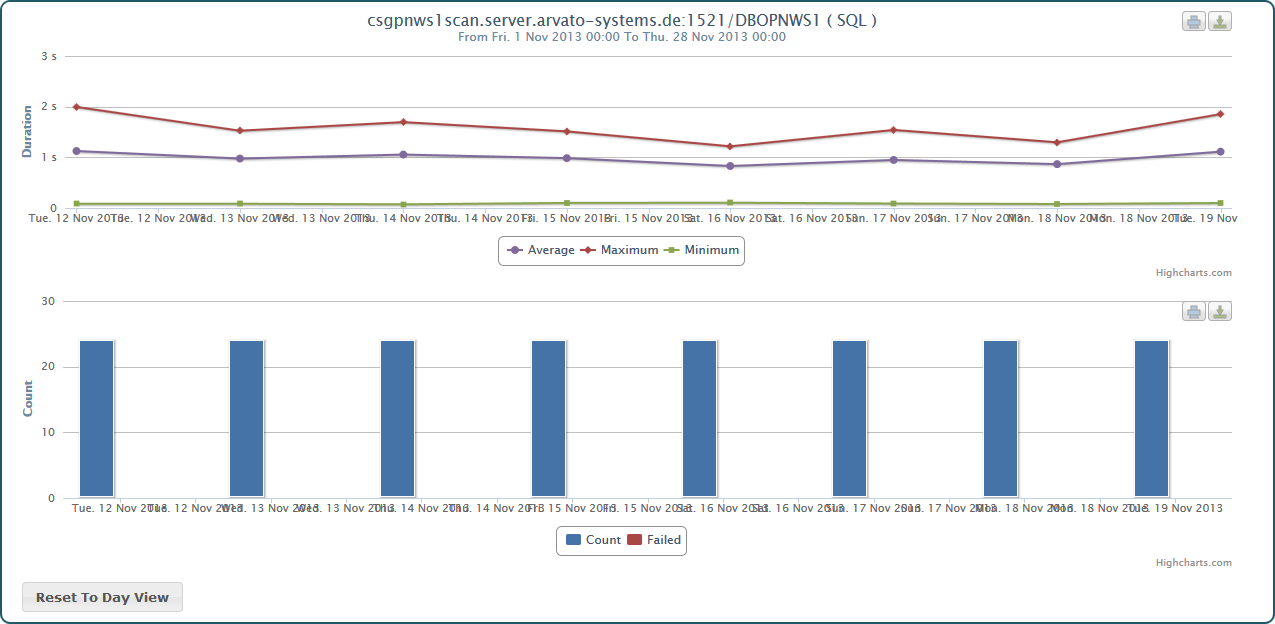 | By clicking the name of the backend, you can switch to the chart view of this backend. The information that is presented by the chart view is described in more detail in Using the Chart View. |
On this Page:
Related Pages:
Overview
Content Tools