A business process can go through different process strands. Analysis of the different variants and the frequency with which they were carried out offers Process Mining users a deeper level of insight into their processes. The variant analysis can also reveal the potential for optimization of the process.
In Process Mining the so-called Process Explorer is available for the analysis of process variants. With the help of the Process Explorer, users can analyze and visualize differing process variants.
The Process Explorer in Overview
| Open the explorer via the Variants sidebar |
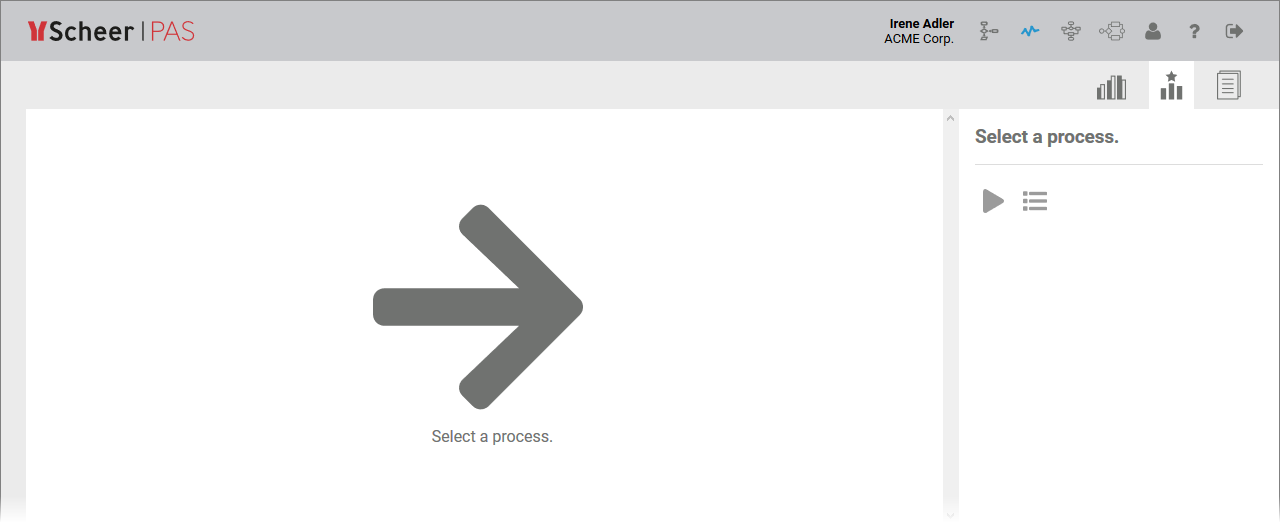
| When you open the process explorer for the first time, you are asked to select a process. The explorer functionality is only activated when a process is selected. The process explorer consists of three areas:
|
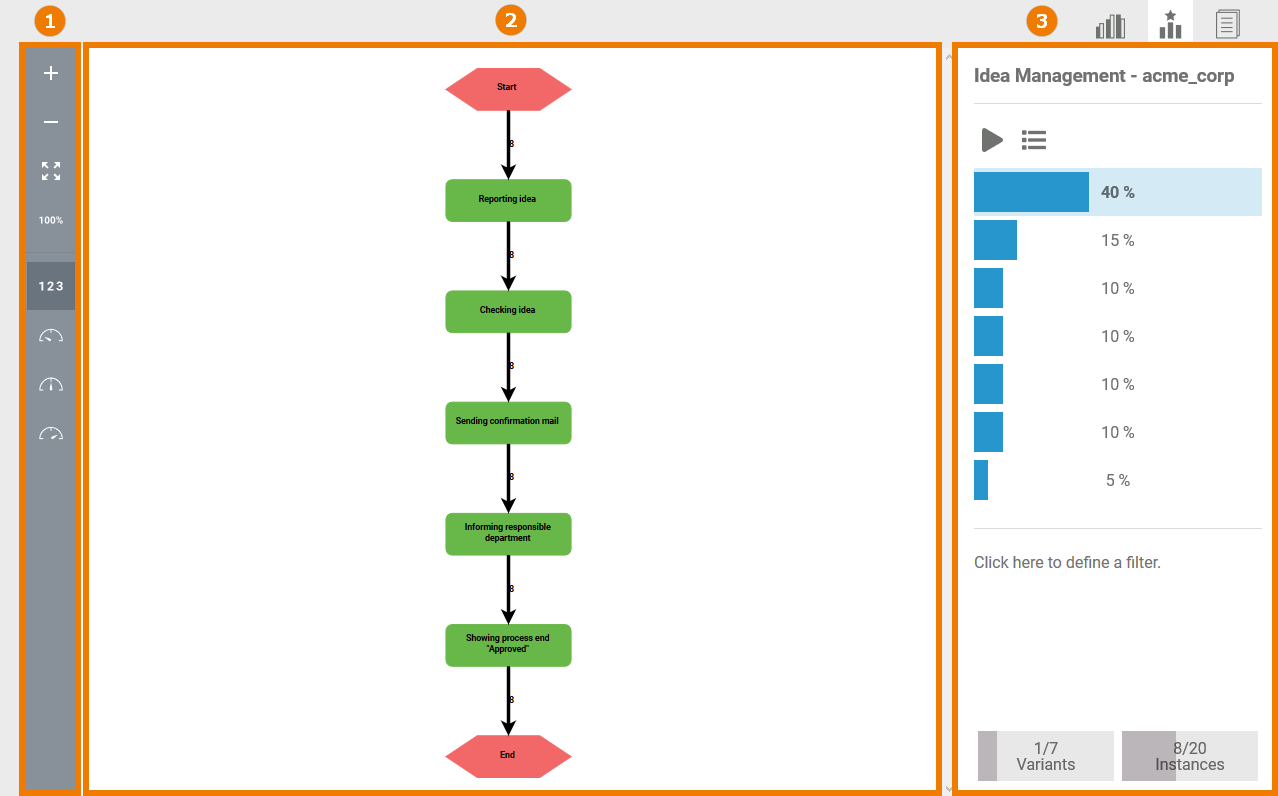
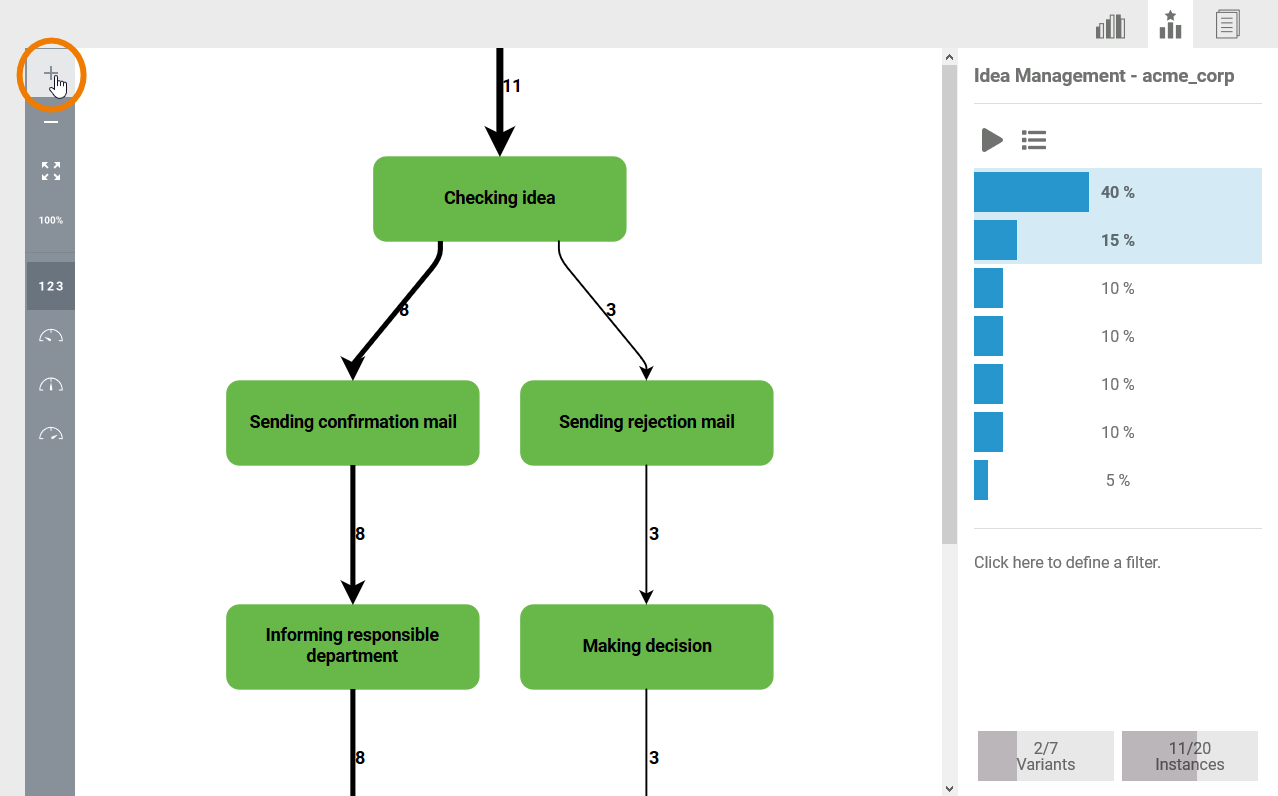
The Model View
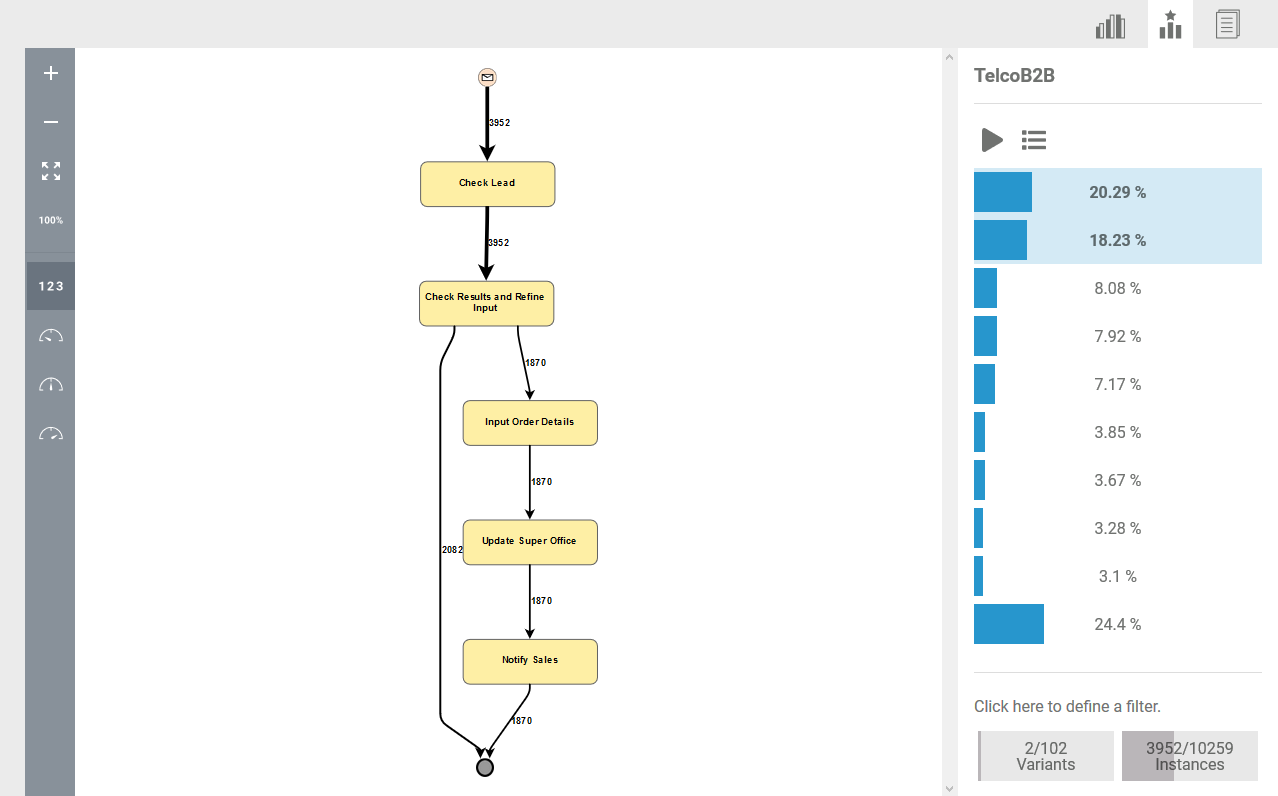
A model of the selected process is displayed on the user interface. The width of the edges indicates the number of instances that have run on this route: the wider the edge, the more instances have run this route.
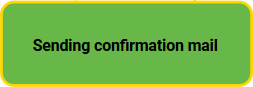
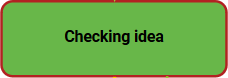
The colors of the edges visualize idle periods, the colors of the element frames visualize processing times:
| Edge | Meaning | Frame | Meaning |
|---|---|---|---|
| Shortest idle period |
| Shortest processing time |
| Average idle period |
| Average processing time |
| Longest idel period |
| Longest processing time |

Customizing the Model View
The displayed process model is interactive. Process Mining users have several options to customize the model view:
- Use the grey toolbar on the left to adjust the basic settings of the model view.
- Use the mouse to modify the process model in the content area - the model is displayed on an editable active dialog window.
Adjustments via the Toolbar
The basic settings of the process view can be adjusted using the toolbar on the left hand side of the process explorer.
| Tool | Action | Effect on the Process View |
 | Enlarging the Model Click on the plus button to enlarge the model view. |
|
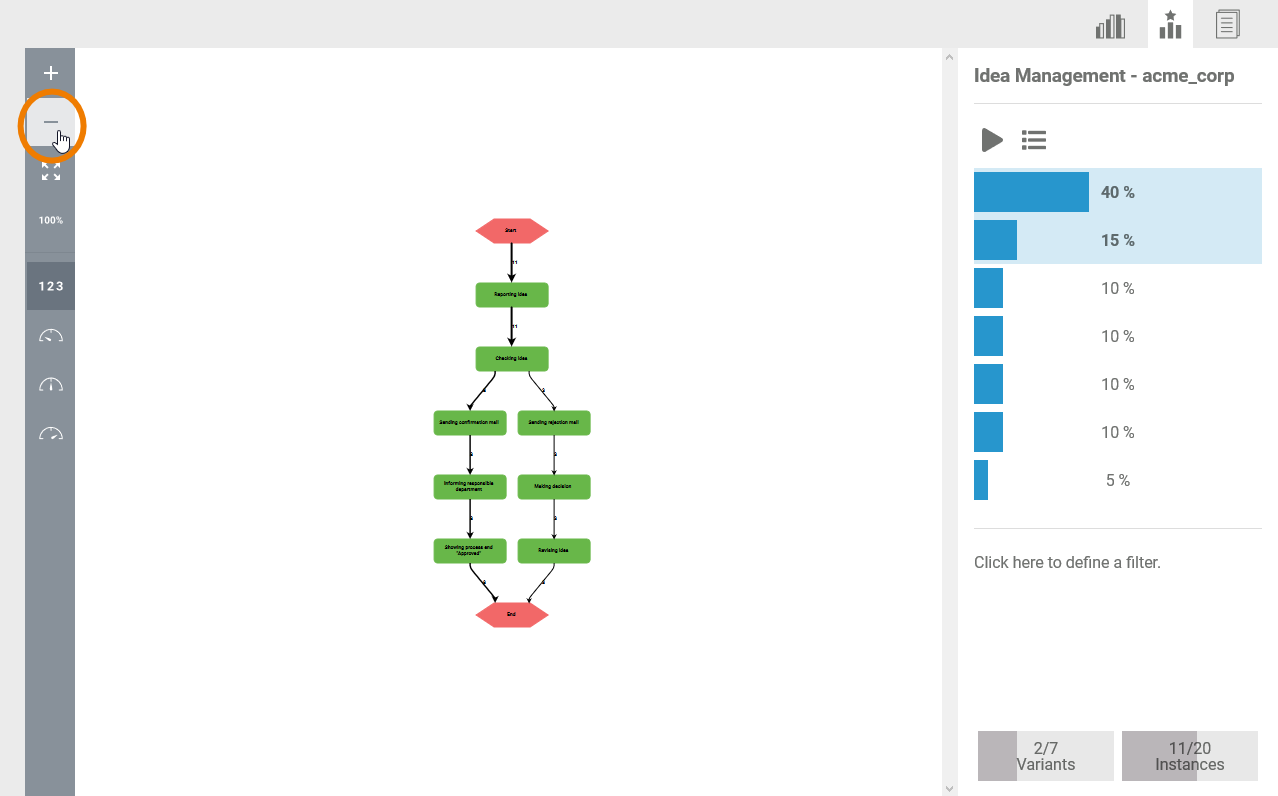
| Reducing the Model Click on the minus button to reduce the model view. |
|
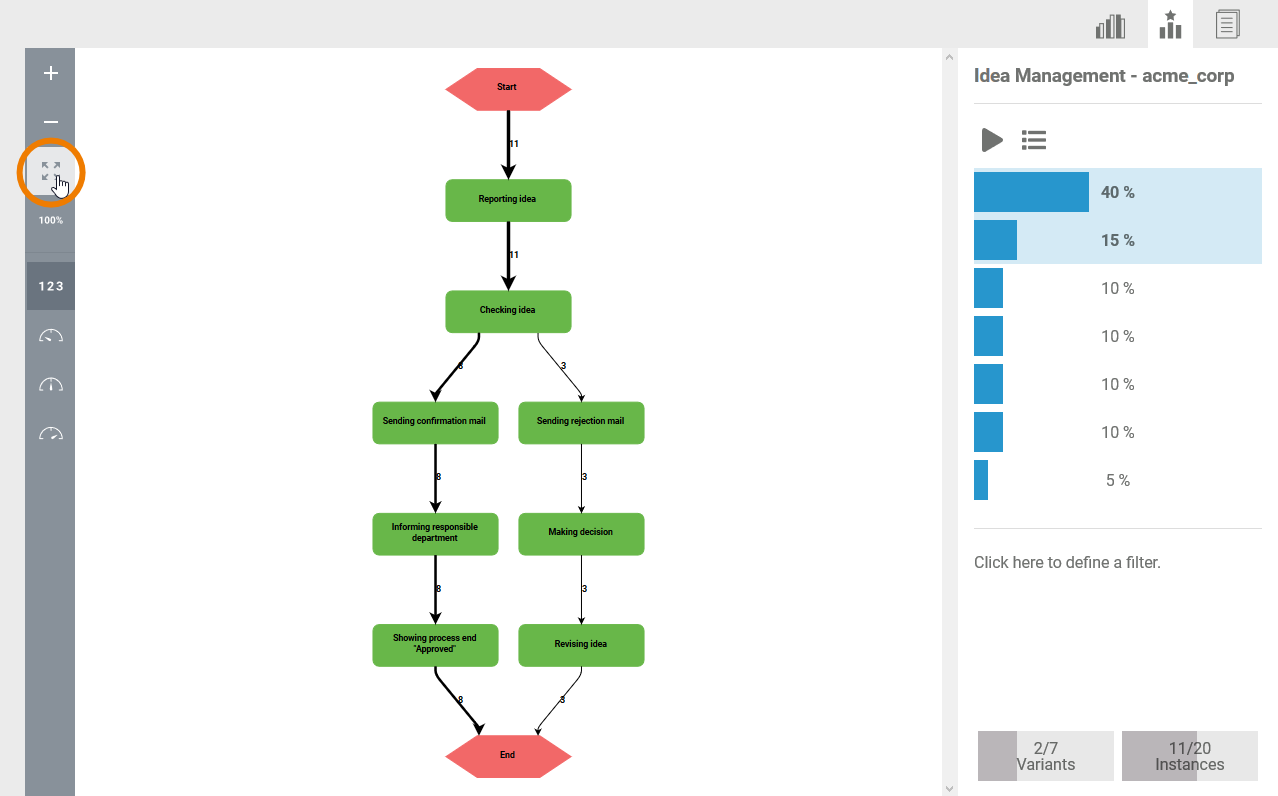
| Getting a Complete View This button positions the model in the content area so that it is completely visible. |
|
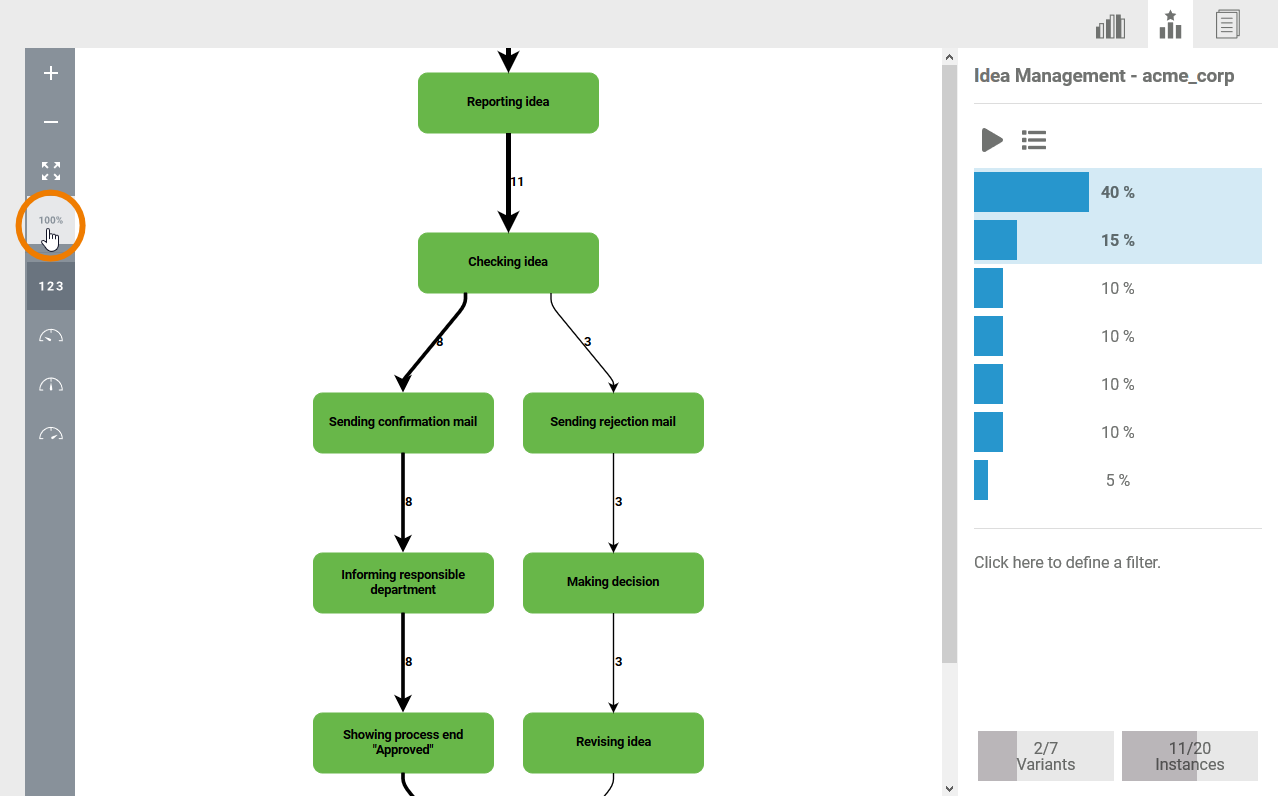
 | Setting the Original Size The process is displayed in its original size via the 100% button. |
|
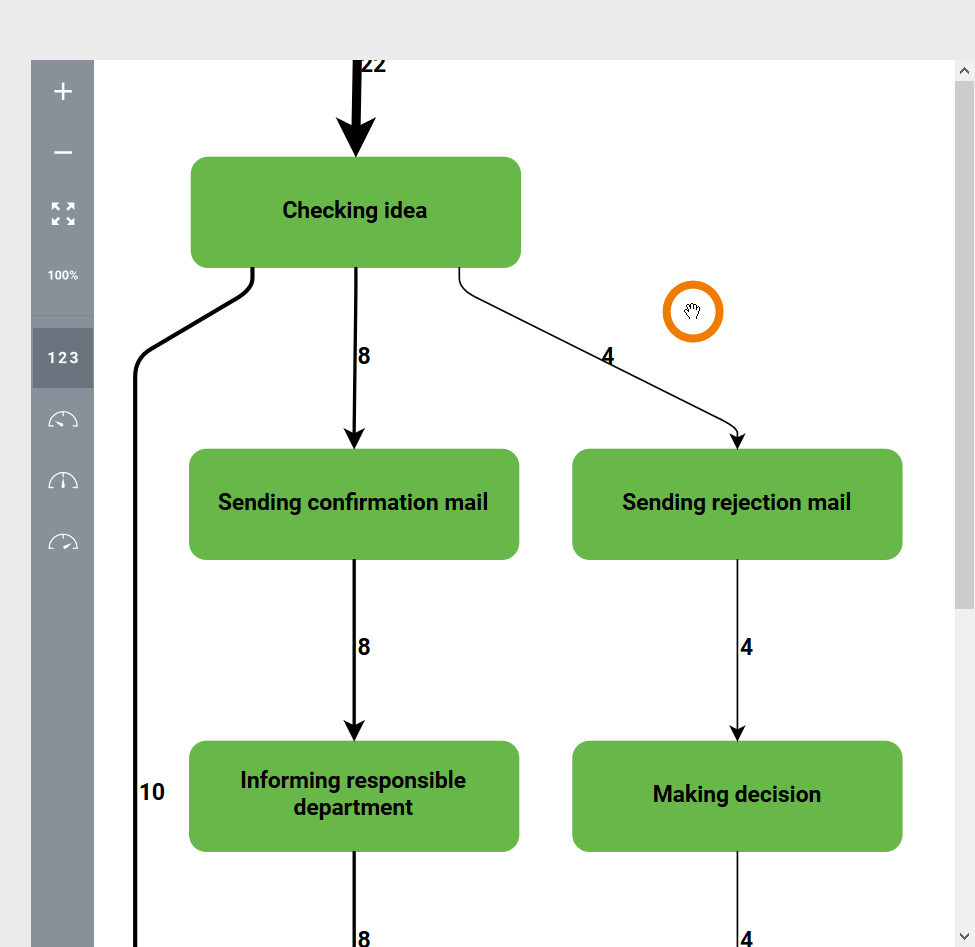
 | Showing the Number of Instances Select this option to display on the connections of the process model the number of instances that have run on this path so far.
|
|
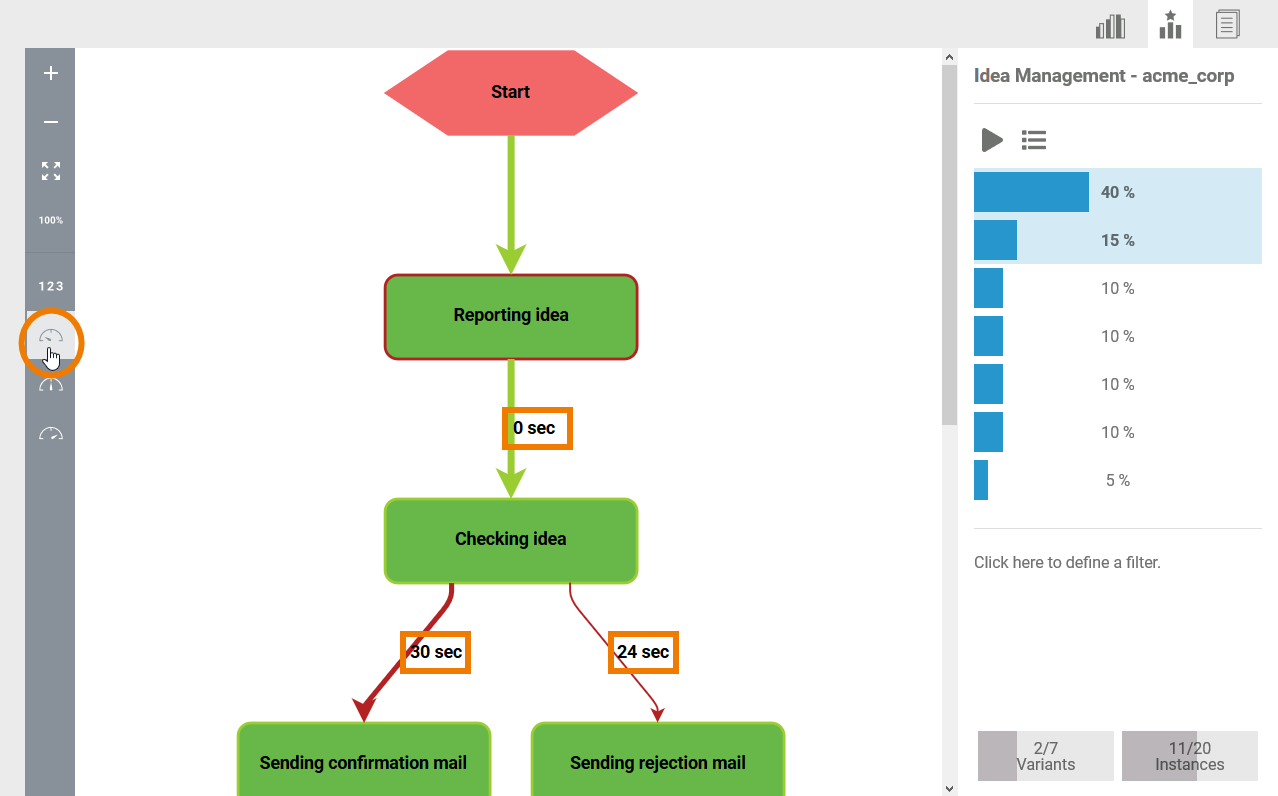
 | Minimum Idle Period Select this option to show the lowest idle period at the connections of the process model. |
|
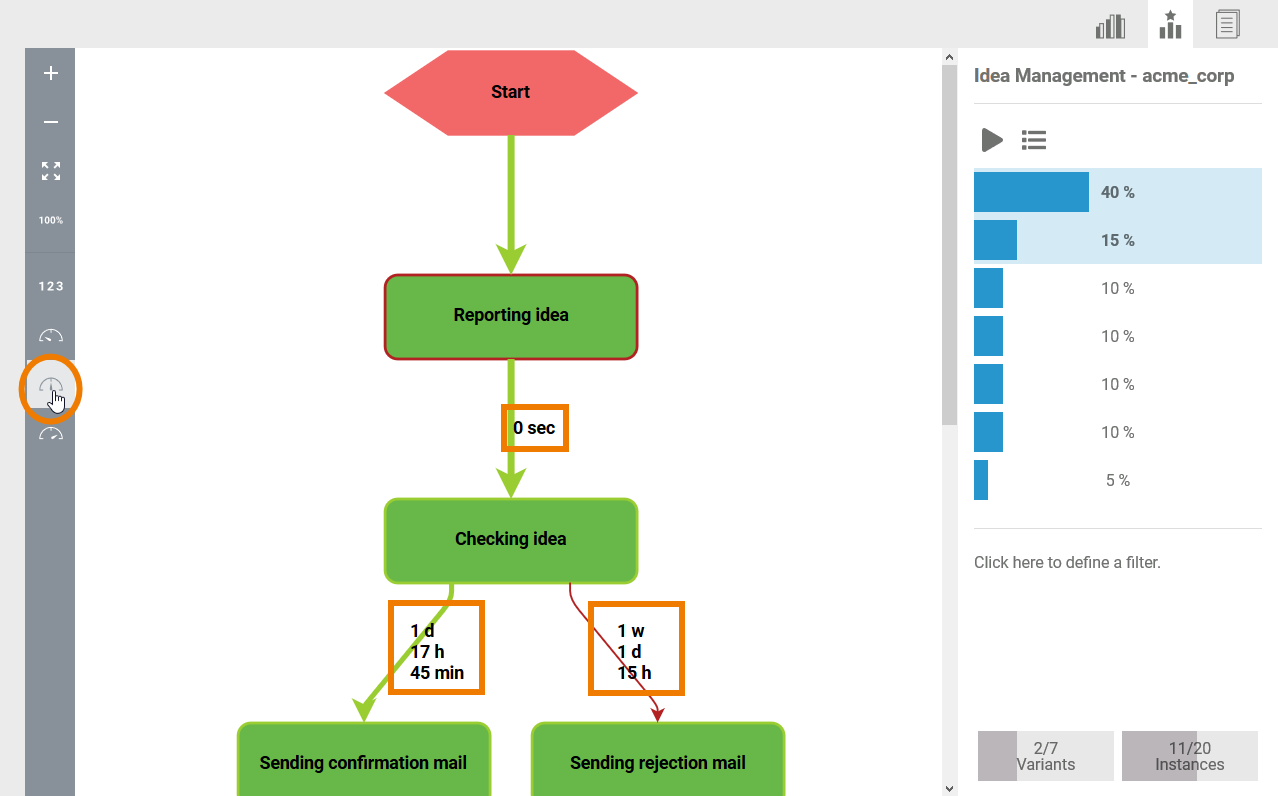
 | Average Idle Period Select this option to display the average idle period at the connections of the process model. |
|
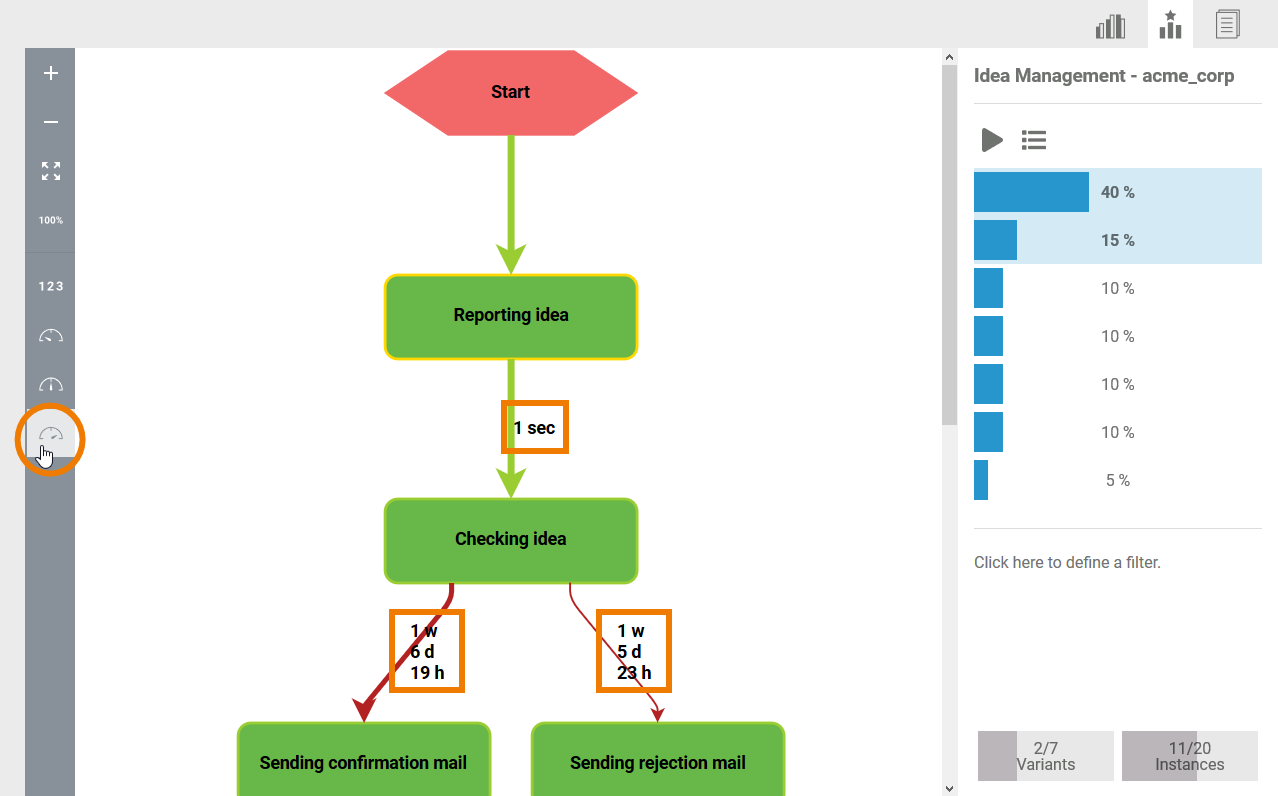
 | Maximum Idle Period Select this option to display the maximum idle period at the connections of the process model. |
|


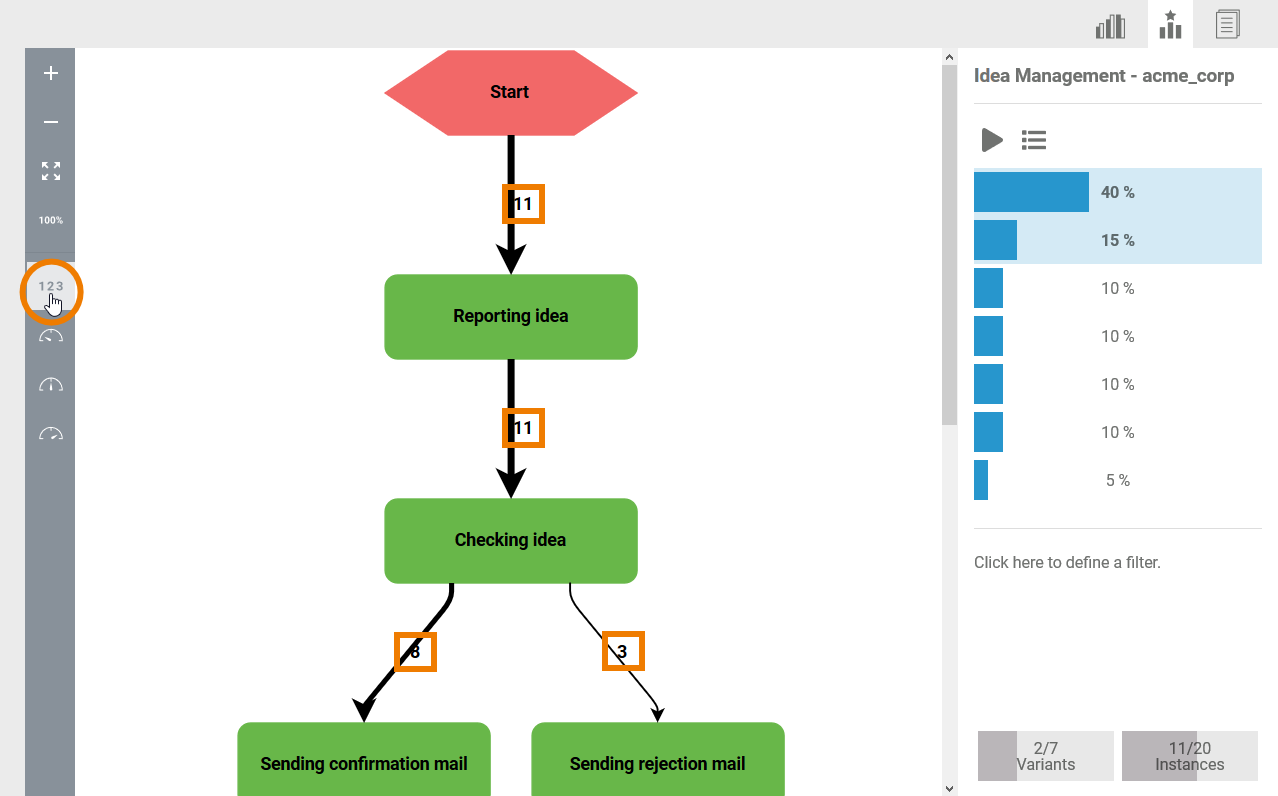
The connections of the process model can represent the number of instances or the idle period.
Adjustments in the Model
The process model is displayed on an interactive dialog window. This allows users to modify the model with the help of their mouse.
Tool | Action | Effect on the Process View |
Mouse wheel | Zooming the Model Position the mouse cursor on the user interface. Use the scroll wheel of the mouse to can enlarge and reduce the model view. |
|
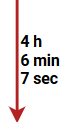
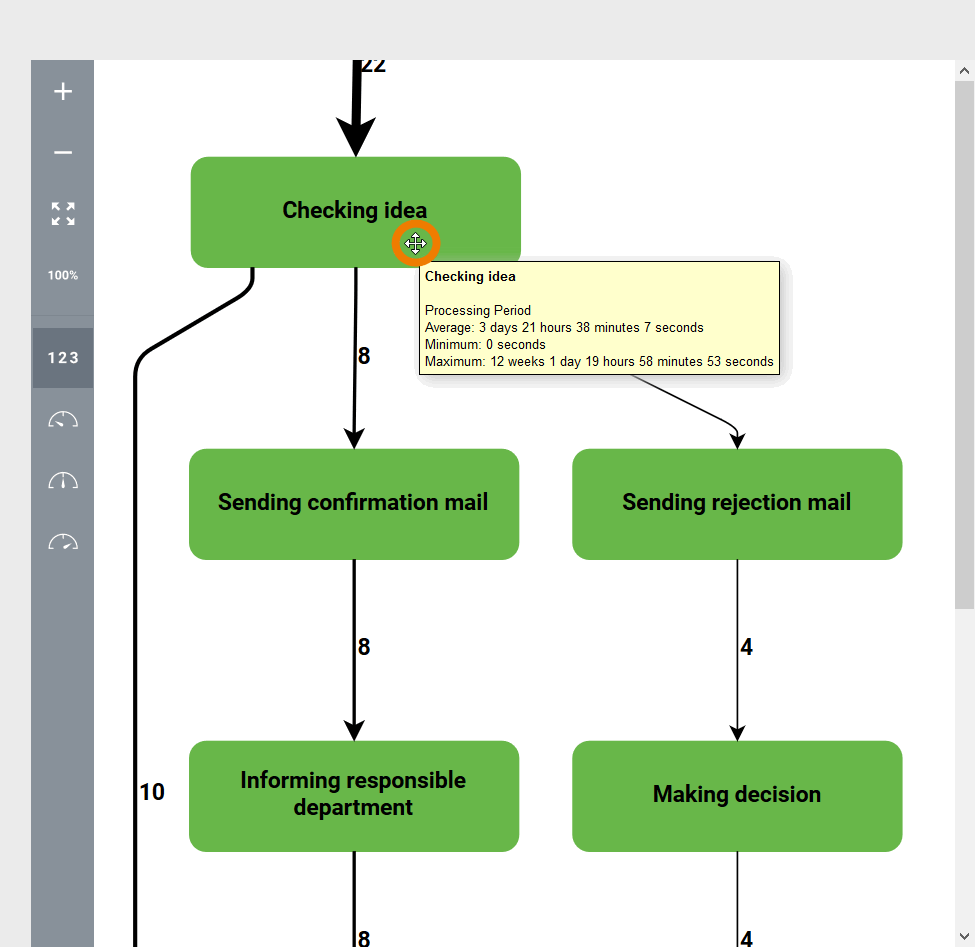
Mouse pointer (cursor) | Showing Processing Times (process steps) Move the mouse cursor over a model element to show the corresponding processing times. The minimum, average and maximum processing times for the current process step are shown. |
|
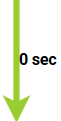
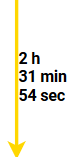
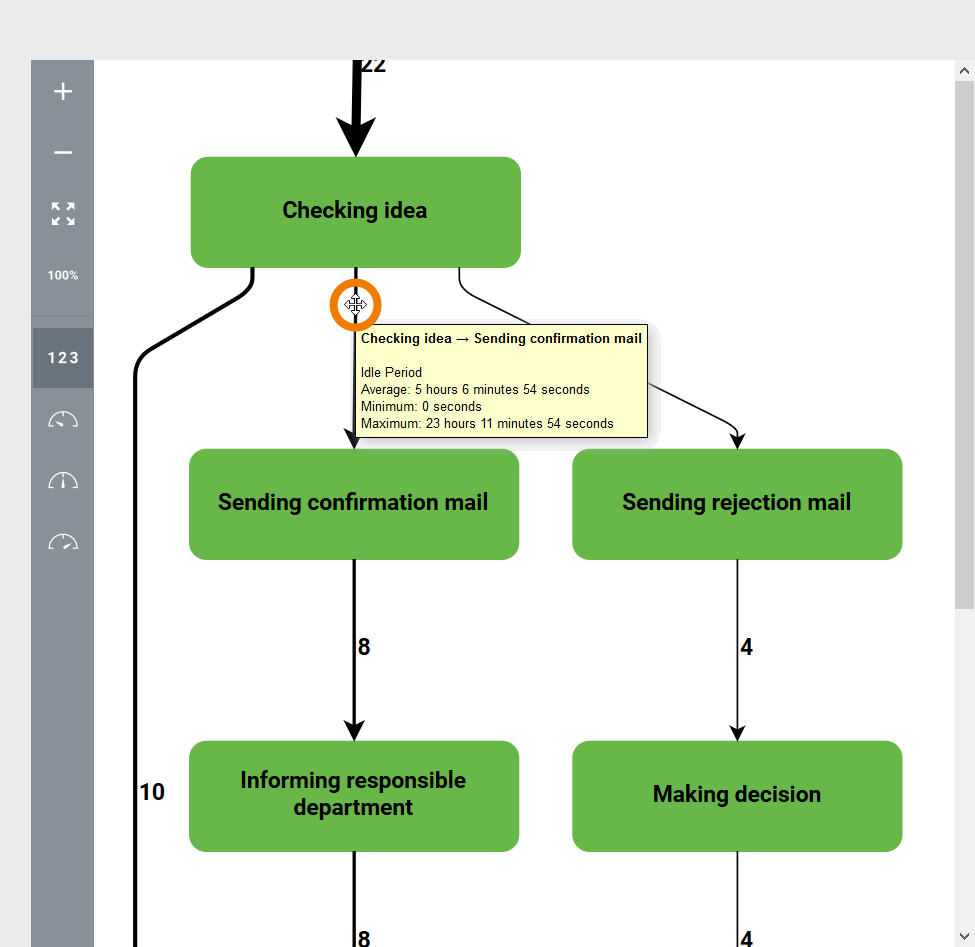
Mouse pointer (cursor) | Showing Idle Times (connections) Move the mouse cursor over an edge to display the associated idle time. The minimum, average and maximum wait times for the current process step are shown. |
|
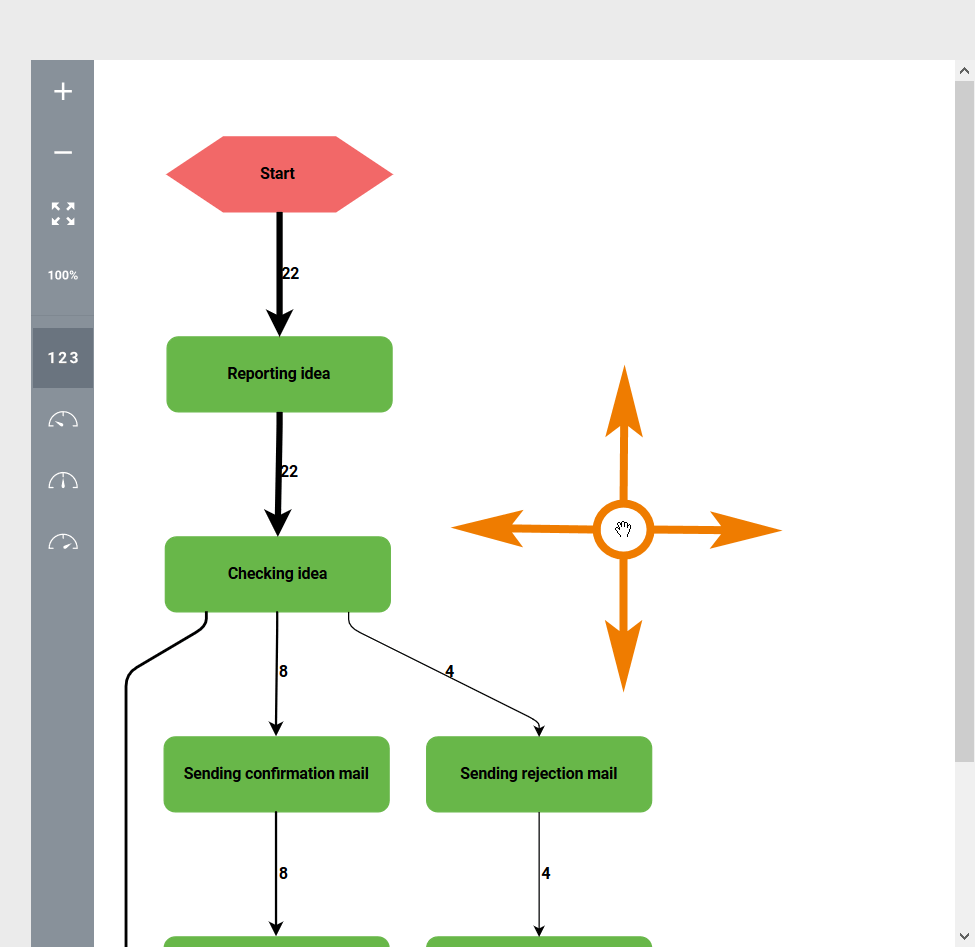
Mouse pointer (cursor) | Moving the Model With the mouse key held down, you can move the entire process model on the dialog window. |
|
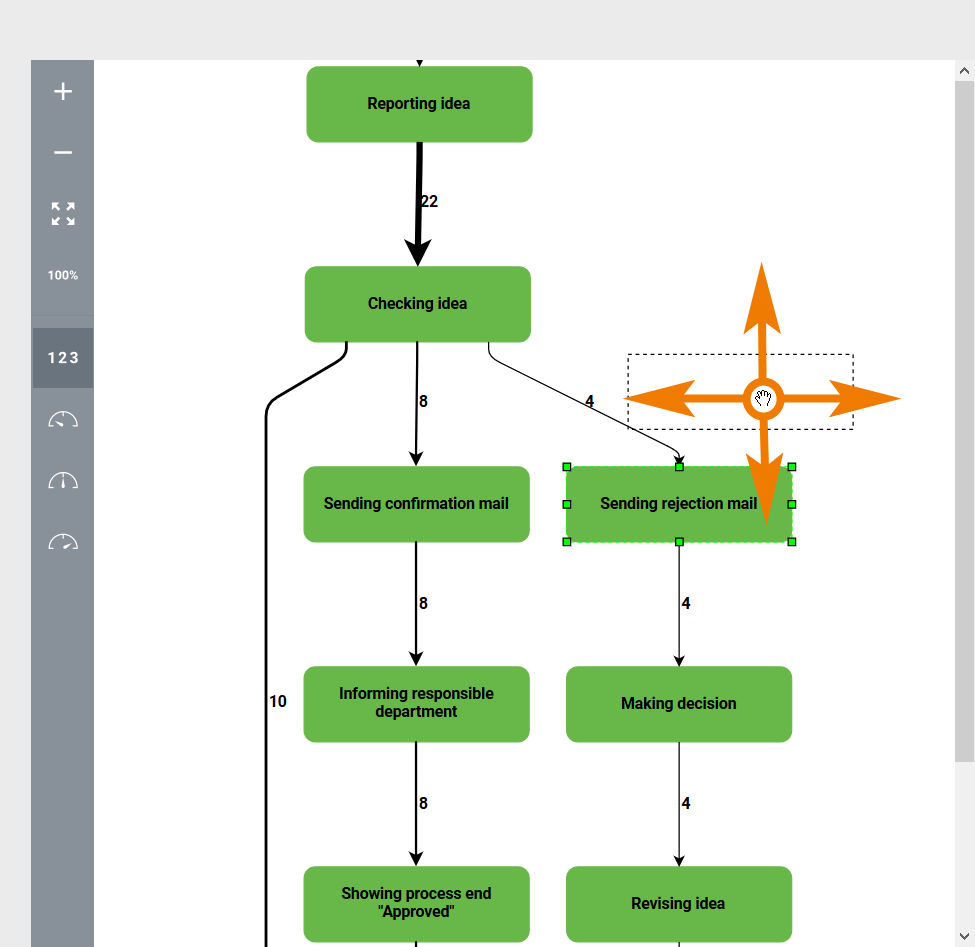
Mouse pointer (cursor) | Moving Elements and Connections Hold the mouse key on an element or a connection of the process model to move the element or the connection. |
|
Analyzing Variants Using the Process Explorer
In order to analyze process variants you must select a process first. You can select all processes your user has access to and that deliver data to Process Mining.
Is the process you are looking for not showing in the list? In order for data from the integration or BPaaS component to be transferred to process mining, the corresponding process must have been run at least once.
Selecting the Process
| Click in section Select a process in the sidebar. |
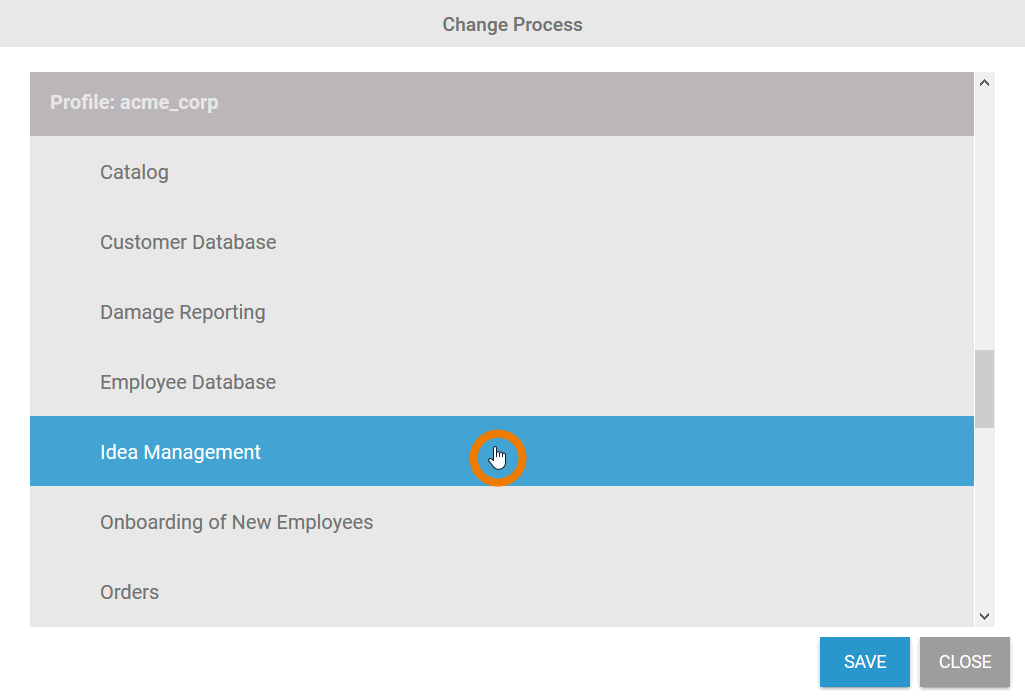
| Dialog Change Process opens. All processes that supply data are displayed in the list. The processes are sorted alphabetically in accordance with profiles and within a profile. Select the process that you want to analyze and apply the selection with Save. Is the process you are looking for not showing in the list? In order for data from the integration or BPaaS component to be transferred to process mining, the corresponding process must have been run at least once. |
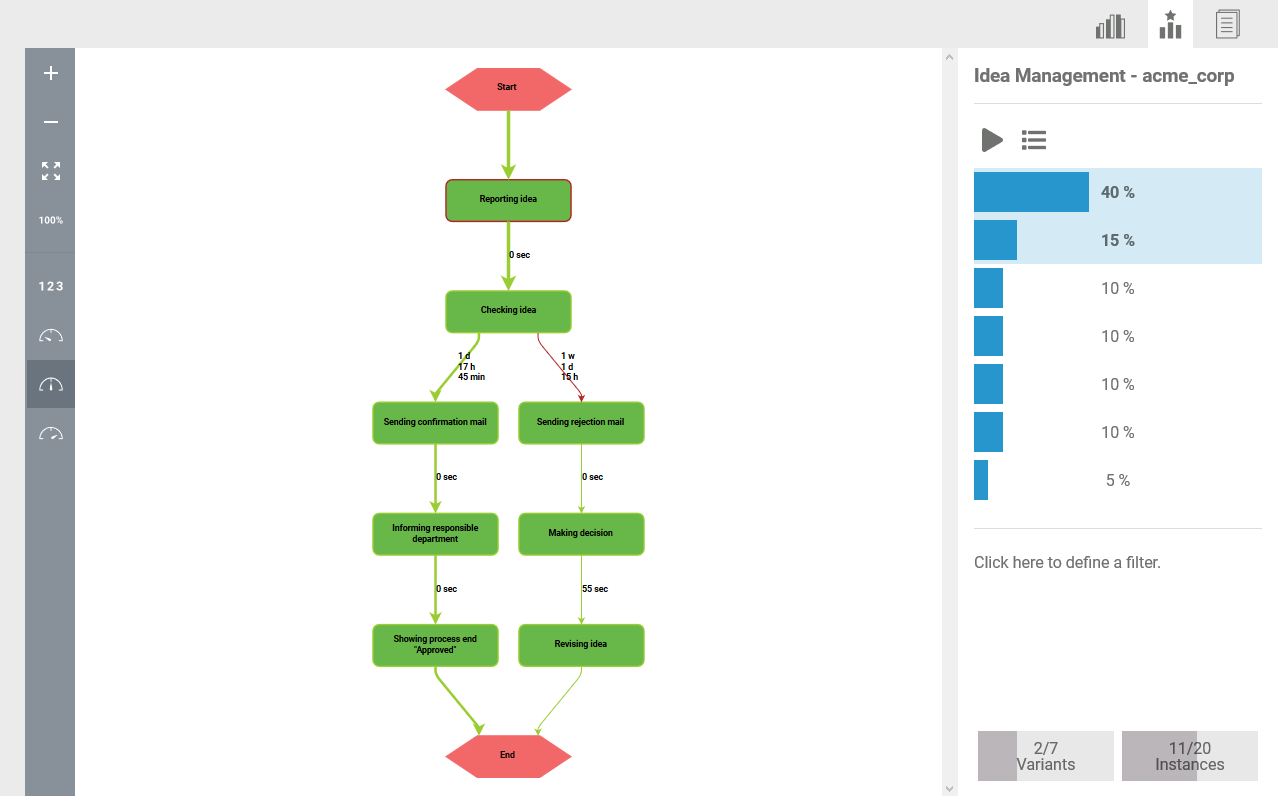
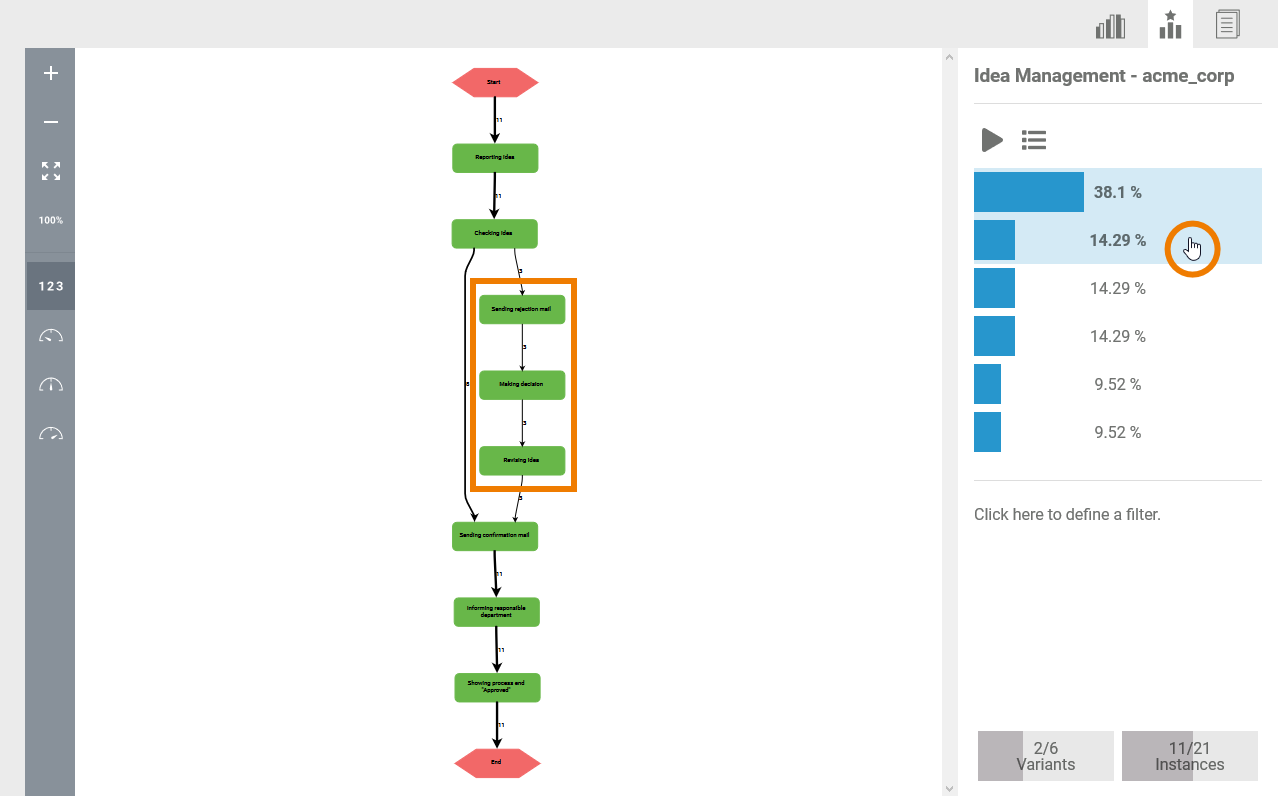
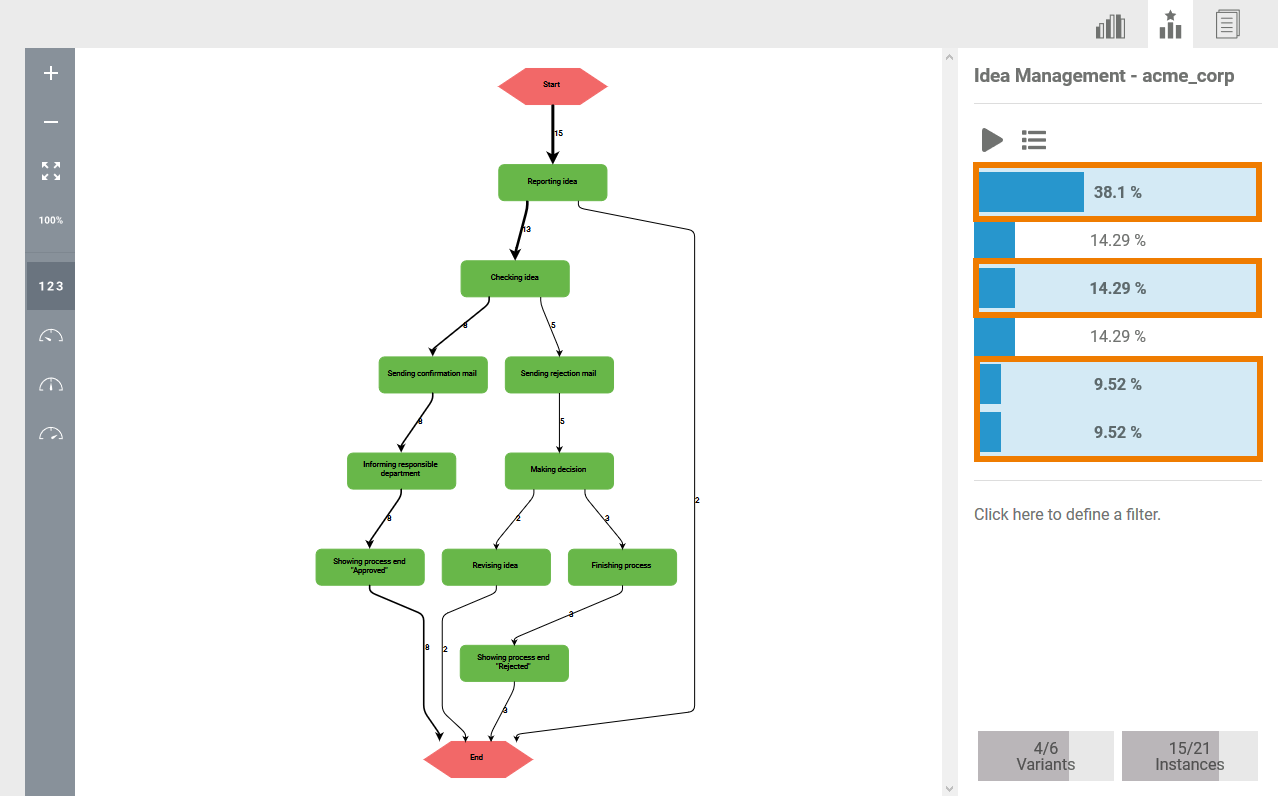
| The selected process is displayed in the content area of the explorer. The model of the process variant that has run the most is always displayed first. This variant is marked in color in the sidebar. |
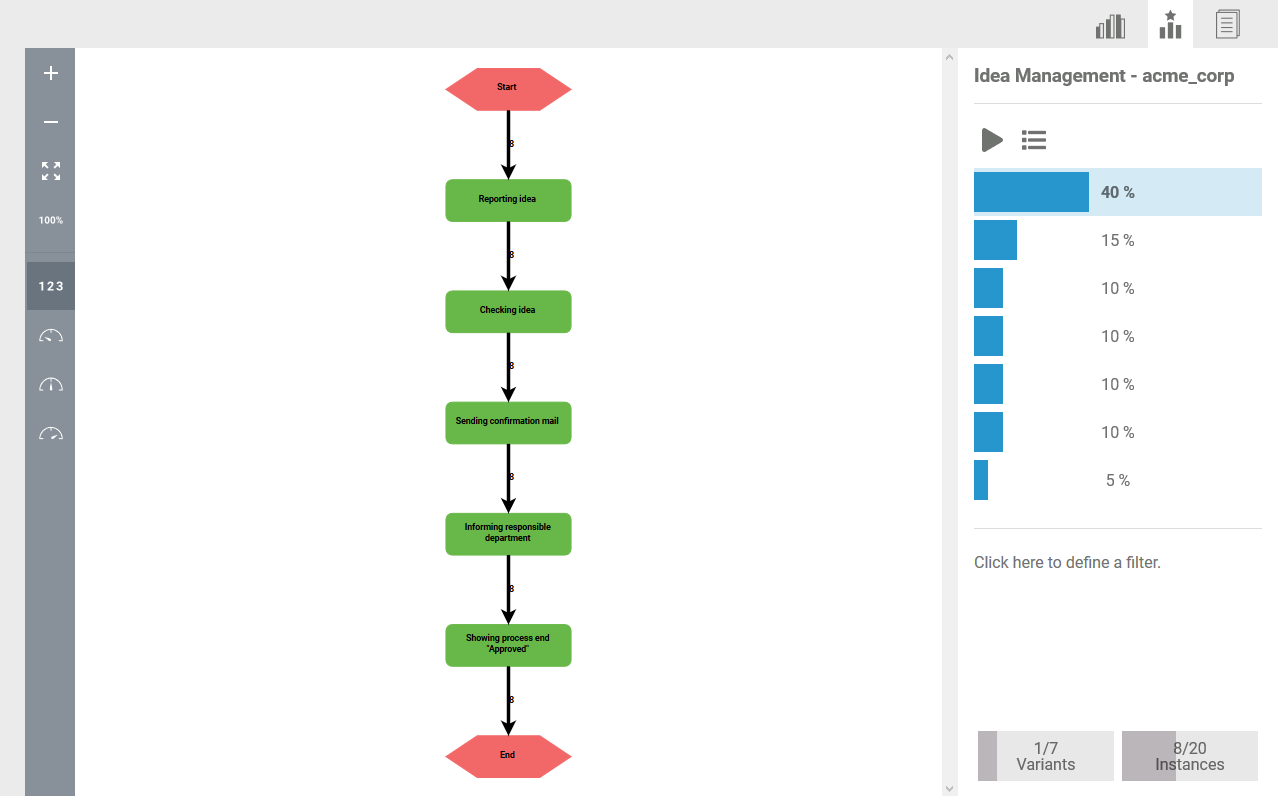
| For users of the integration component (Bridge), processes are shown as BPMN models. |
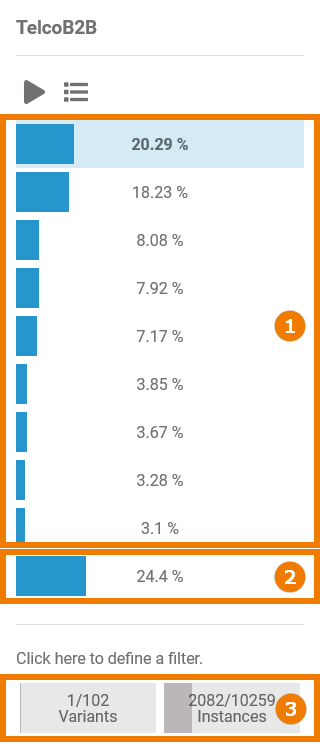
Managing Variants
You can use the variants sidebar to manage variant analysis. Use the sidebar to get an overview of all the variants that have been run and to adapt the model view in the content area according to your wishes.
|
|
| You can add further variants to the model in the content area: Click on the desired variant in the sidebar. The added variant is marked in color. The model is reloaded and extended to include the new variant. The overview in the sidebar will also be adjusted. |
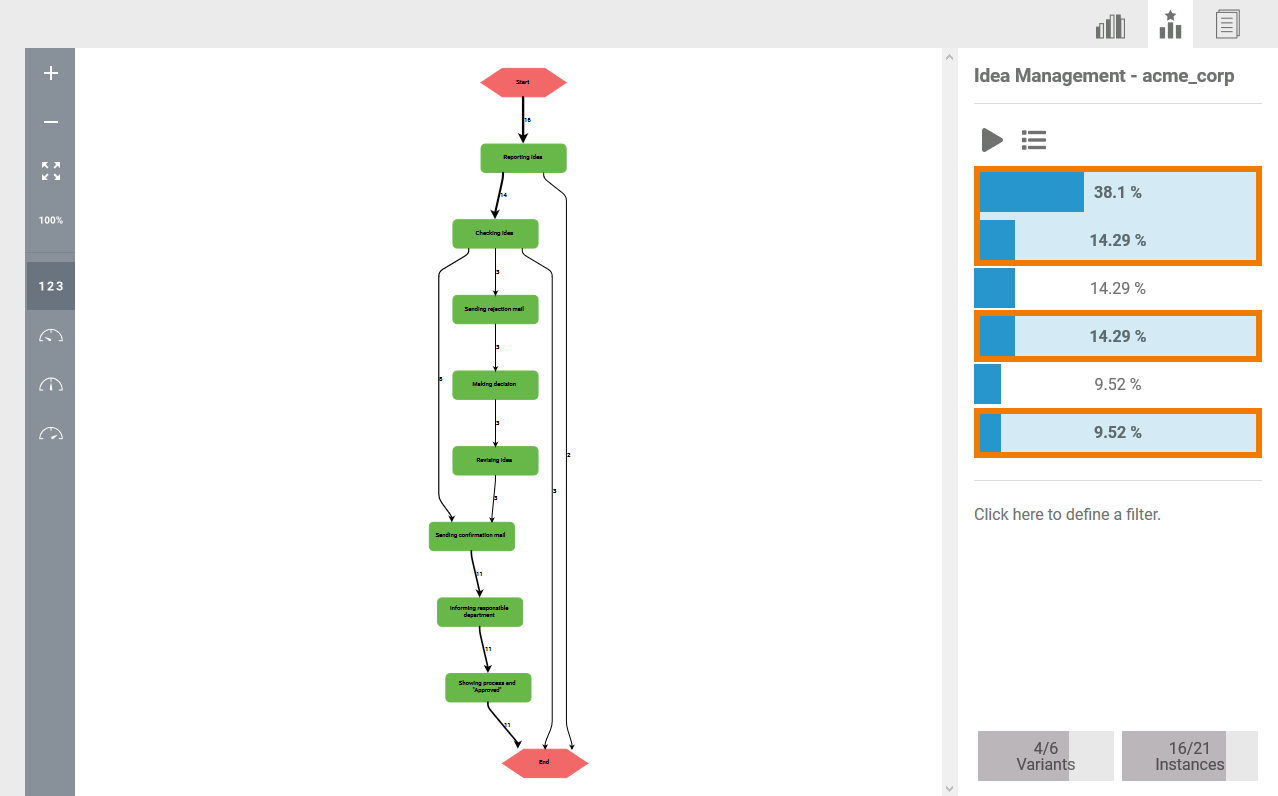
| The process model in the content area can be expanded by the addition of further variants. The more variants clicked, the more extensive the model. All the variants shown in the model are marked in color in the sidebar. Click on a marked variant to remove it from the model. |
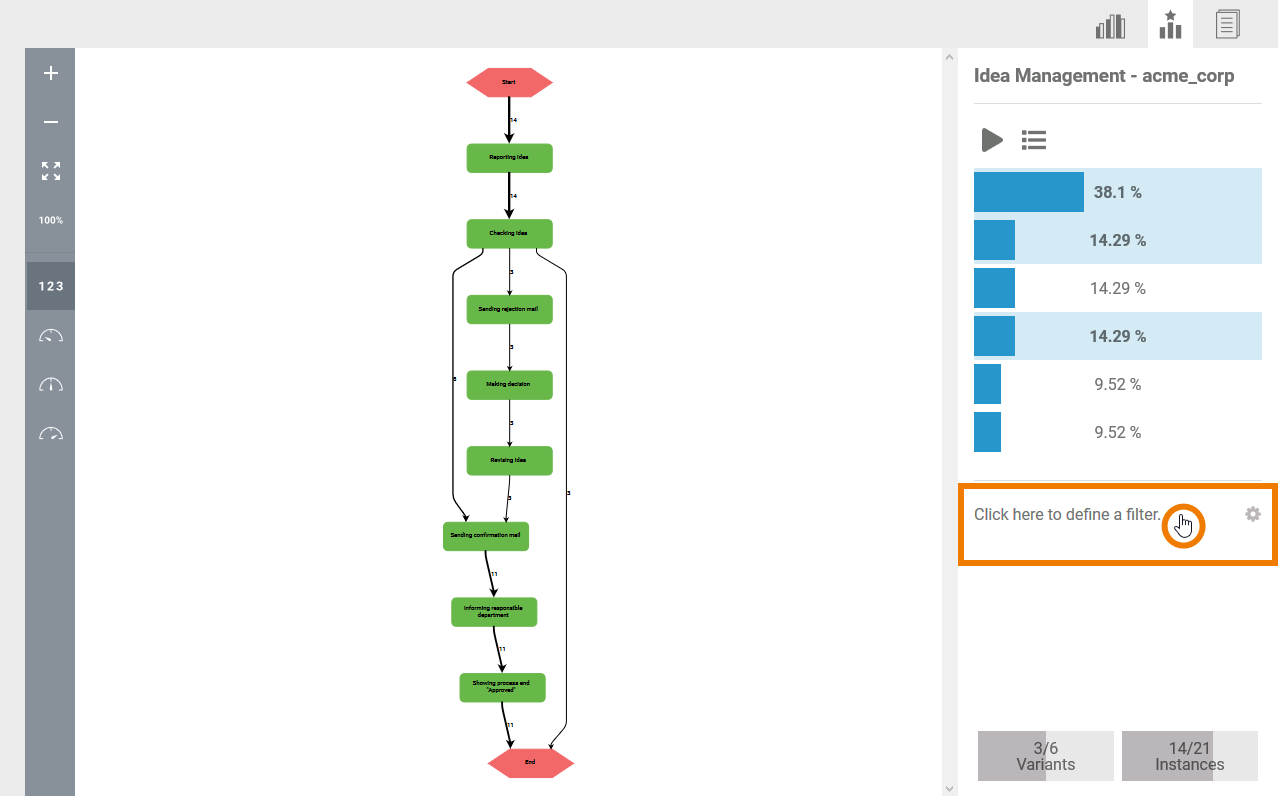
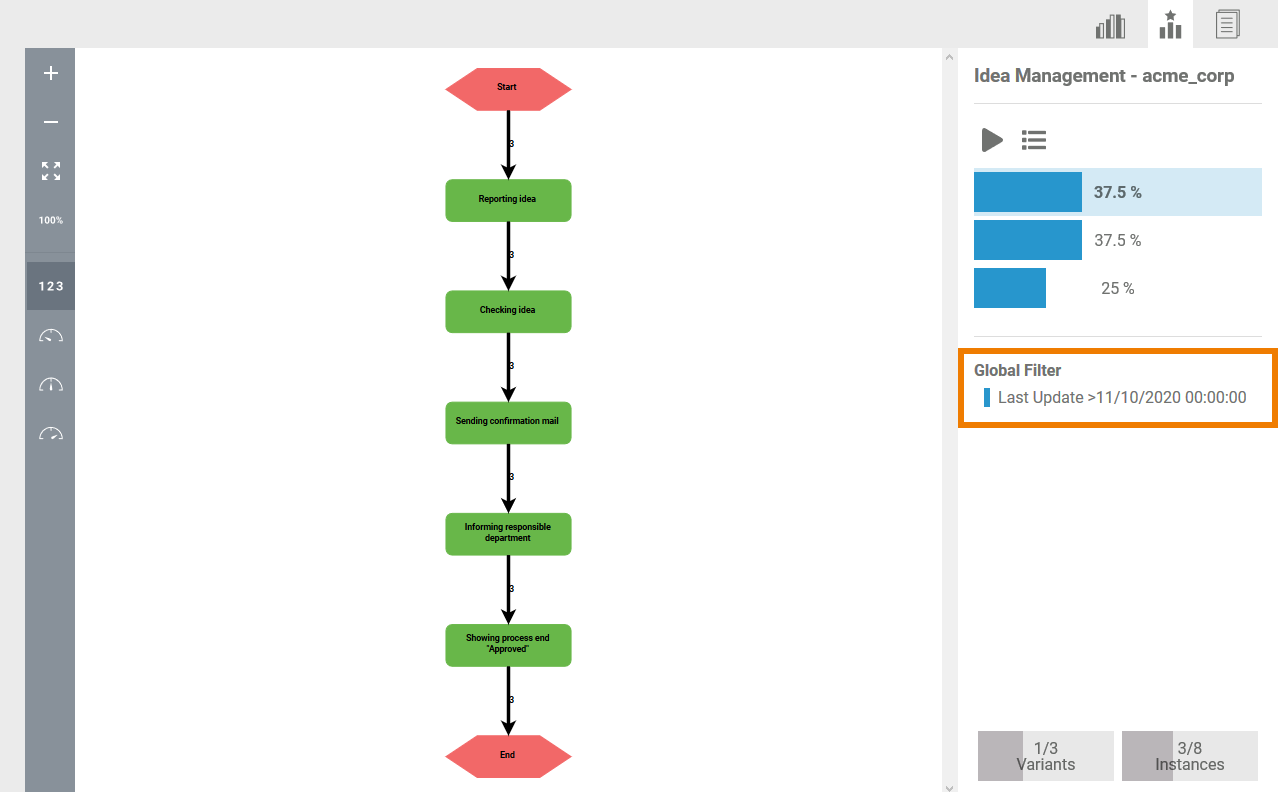
Setting Filters
All process data are used initially for analysis with the process explorer. However, you can define your own filters and thereby limit the basis for the variant analysis.
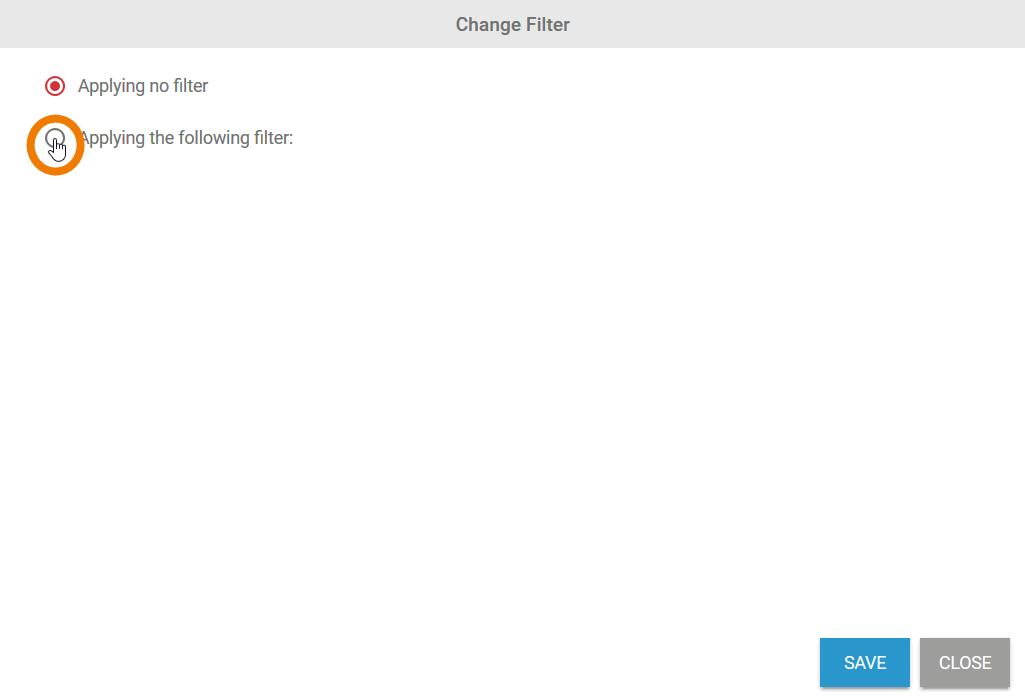
| To do this, click on the filter area. |
| In the Change Filter pop-up window, select option Applying the following filter. Refer to Configuring Filters for detailed information about all filter settings. |
| The filter set is applied to the process data and shown in the sidebar. |
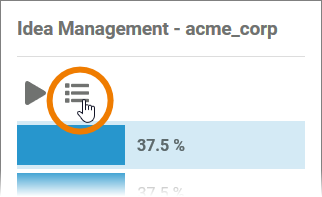
Displaying the Instance List
During a variant analysis it's possible that you uncover abnormal data that requires a closer look. To do this, you can open the instance list from the process explorer.
| Use option |
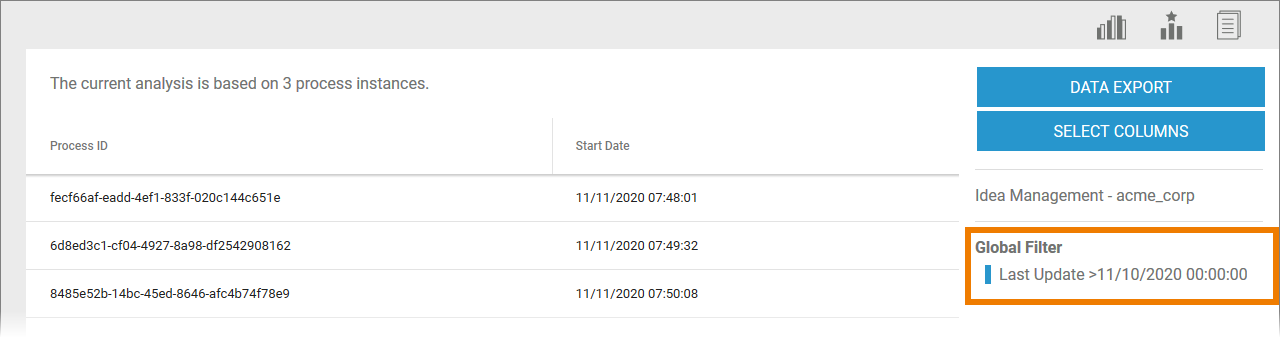
| The instance list shows the instances of all variants selected in the process explorer. If a filter has been set in the explorer, this filter is also applied to the instance list. Changes to the filter in the instance list do not affect the filter in the process explorer. |
Refer to Examining Instances for more details about configuration options for the instance list. On this page you will also learn how to use the instance list to examine instances.
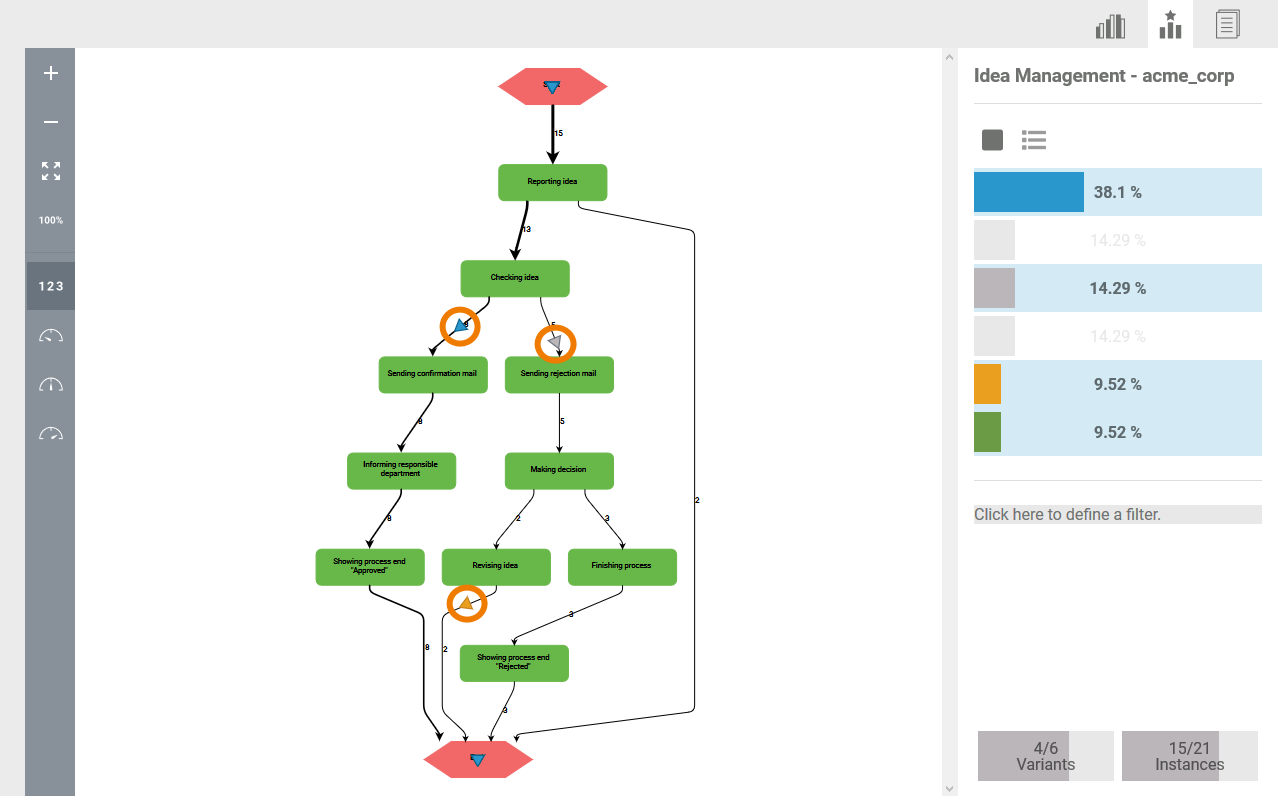
Simulating Process Flows
Using the Variants Sidebar, it is also possible to simulate different process flows. The different variants are represented in the simulation arrows in various colors. The arrows trace the paths of the instances.
| In the sidebar, first select the variants whose process flows you wish to simulate. |
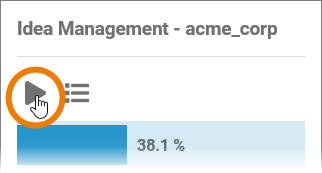
| Use the play button in the sidebar to start the simulation. |
The simulation starts to run. Each arrow represents an instance. Each color represents a variant. You can now track which path an instance has taken via the simulation: The arrows follow the edges in the order in which the underlying instance has run through the system.
On this Page:
Related Pages:
Overview
Content Tools