| Chapter | Name | Excerpt | |||||||||||||||
|---|---|---|---|---|---|---|---|---|---|---|---|---|---|---|---|---|---|
| Analysis - Filter | attribute_filter | Once the basis for filtering has been defined, individual attribute filters can be created:
To select an instance attribute, expand the Field selection list. | |||||||||||||||
| Analysis - Axis allocation | axis_aggregation | For key indicators on the y-axis the aggregation required can be set using a selection list. An exception here is the number of processes as aggregating these is not appropriate. | |||||||||||||||
| Analysis - Axis allocation | axis_aggregation_unit | The choices available are:
| |||||||||||||||
| Analysis - Axis allocation | axis_allocation_drag | To use an attribute, drag it from the list onto the area of the corresponding axis. Only instance attributes with the matching symbol can be dragged onto the corresponding axis. | |||||||||||||||
| Analysis - Axis allocation | axis_allocation_error | If instance attributes of differing levels are mixed, the resulting chart is not meaningful. The wizard therefore displays the following message: You have combined process level attributes with step level attributes. This allocation does not lead to meaningful results. Please change your selection of instance attributes. Attributes which match are highlighted in color. | |||||||||||||||
| Analysis - Axis allocation | axis_allocation_green | A green frame signals to the user that they are saving the selected instance attribute in the correct axis area. | |||||||||||||||
| Analysis - Axis allocation | axis_allocation_intro | You can determine which instance attributes should be displayed in the chart in the axis allocation step. The instance attributes available are listed on the left. Individual instance attributes are explained in more detail in the Process Mining Glossary. | |||||||||||||||
| Analysis - Axis allocation | axis_allocation_list | The two areas for the content of the x and y axis are located on the right hand side of the pop-up window.
In distribution charts (all chart types except tachometer), key indicators can also be displayed as a dimension on the x-axis. | |||||||||||||||
| Analysis - Axis allocation | axis_allocation_red | Die korrekte Zuordnung von Dimensionen und Kennzahlen wird visuell unterstützt. Wenn der Anwender versucht, ein Instanzmerkmal auf der falschen Achse abzulegen, wird der Bereich rot umrahmt. | |||||||||||||||
| Analysis - Axis allocation | axis_allocation_time | Für zeitliche Dimensionen kann die Zeiteinheit festgelegt werden. Dies gilt für die folgenden Instanzmerkmale:
| |||||||||||||||
| Analysis - Axis allocation | axis_allocation_time_units | Eingestellt werden können:
| |||||||||||||||
| Installation | collection_level |
The higher the collection level the more information will be collected and the more data will be stored in the database of Scheer PAS Process Mining. If you do not need to analyze your processes and services down to all IO operations, it is sufficient to set your collection level to e.g. Service to take load of your database server. However, in case you need to analyze a process or service further down than the collected data allows, you could easily upload the corresponding transaction logs manually with a higher collection level (given that the transaction log level of the service allows that). But keep the following in mind: If you manually upload a transaction log of a service with collection level e.g. IO whose data has already been collected with collection log level e.g. Service, the already collected data will be doubled. For these cases, we recommend to distinct the manually uploaded logs by e.g. a different host. Otherwise your process or service statistics could get distorted. | |||||||||||||||
| Analysis - Filter | filter_basis | Im ersten Feld wird über die Auswahlliste die Grundlage der Filterung bestimmt:
| |||||||||||||||
| Analysis - Filter | filter_contains | Beispiel: Schritt enthält %ende% Angezeigt werden alle Instanzen, die im Instanzmerkmal Schritt den String Ende enthalten. Berücksichtigt werden auch die Schritte, bei denen vor oder nach dem String Ende noch weitere Zeichen stehen. | |||||||||||||||
| Analysis - Filter | filter_create | Wenn Sie die Option ändern auf Folgenden Filter hinterlegen, wird die Filtereingabe eingeblendet. | |||||||||||||||
| Analysis - Filter | filter_duration | Die Eingabe einer Dauer (Prozessdauer, Schrittdauer) erfolgt ganzzahlig. Eine einzelne Zahl wird als Sekundenangabe interpretiert. | |||||||||||||||
| Analysis - Filter | filter_duration_display | Nach dem Beenden der Eingabe werden die verwendeten Zeiteinheiten automatisch ausgeschrieben. | |||||||||||||||
| Analysis - Filter | filter_duration_no | Wenn die Eingabe einer Zeiteinheit nicht eindeutig ist, wird ein entsprechender Hinweis eingeblendet. | |||||||||||||||
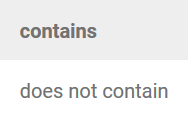
| Analysis - Filter | filter_operator_contains | Wird der Operator enthält verwendet, kann bei der Eingabe im Feld Wert mit Wildcards gearbeitet werden. Erlaubt sind folgende Platzhalter:
| |||||||||||||||
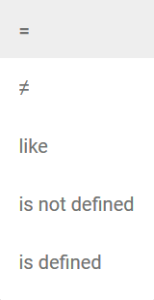
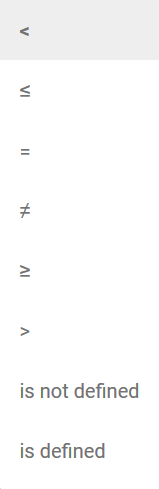
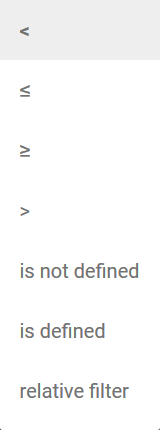
| Analysis - Filter | filter_operator_table | Vier Gruppen von Instanzmerkmalen und zugehörigen Operatoren werden unterschieden:
| |||||||||||||||
| Analysis - Filter | filter_operators | Je nach ausgewähltem Instanzmerkmal stehen im Anschluss verschiedene Operatoren zur Verfügung. Die verfügbaren Operatoren können über eine Auswahlliste angezeigt werden. | |||||||||||||||
| Analysis - Filter | filter_time_units | Auch die Eingabe von Wochen, Tagen, Stunden und Minuten kann mit entsprechenden Kürzeln eingegeben werden:
| |||||||||||||||
| Analysis - Filter | filter_value | Wurde ein Operator ausgewählt, kann der zugehörige Wert eingetragen werden. | |||||||||||||||
| The user interface | load_all | Die Instanzdaten aller Analysen im Process Analyzer werden neu geladen...
| |||||||||||||||
| Analysis - Filter | manage_filter | Verwalten Sie Ihre Filter mit Hilfe der drei eingeblendeten Buttons:
| |||||||||||||||
| General tips | mining_authorization | Ein Benutzer von Process Mining ist berechtigt, Analysen für alle Prozesse anzulegen, die in seinen Profilen abgespeichert sind. Wenn einem Benutzer die Berechtigung für ein Profil entzogen wird, kann er auch die darin gespeicherten Prozesse nicht mehr analysieren. Hat er bereits Analysen angelegt, wenn er die Berechtigung für ein Profil verliert, wird die Analyse im Inhaltsbereich mit dem Hinweis Keine Berechtigung, um diesen Prozess zu analysieren versehen. Hinweis für Administratoren: Das Zuordnen von Berechtigungen und Profilen wird im Administration Guide ausführlich erläutert. | |||||||||||||||
| Analysis | note_axis_allocation | The settings possible for axis allocation are explained in detail on the Configuring Axis Allocation page. | |||||||||||||||
| Analysis | note_filter_config | Auf der Seite Configuring Filters werden alle Filtereinstellungen näher erklärt. | |||||||||||||||
| Installation | pa_prerequisites | Parts of Process Mining and of the Platform Services are delivered as a Node.js package. In order to run these, you need a specific Node.js version. Additionally, Process Mining runs some xUML services on a BRIDGE installation. Please respect the following dependencies:
| |||||||||||||||
| Installation | platform_services | Scheer PAS Process Mining will only run if the platform services have been installed and configured. The Platform Services Installation Guide explains how to do this. | |||||||||||||||
| Analysis | process_list | Der gesuchte Prozess wird in der Liste nicht angezeigt? Damit Daten von Scheer PAS BRIDGE bzw. Scheer PAS BPaaS an Process Mining übergeben werden können, muss der entsprechende Prozess mindestens einmal ausgeführt worden sein. | |||||||||||||||
| The user interface | reload | Die Instanzdaten einer Analyse werden neu geladen...
|
Overview
Content Tools