With PAS 21.1.4 the xUML monitoring service is integrated in the platform.
If you are using the monitoring base service within a Bridge installation already and you want to use the new xUML Service Monitor, please contact our support team. We will then transport your configuration so that you can use the new user interface in the portal.
Accessing the xUML Service Monitor
Scheer PAS contains a standard monitoring for services that are running in the integration component (Bridge). The monitoring services catches all exceptions thrown in the integration component and, by default, reports them by email and/or JIRA. Each distinct exception (distinction per service - error category - error code - error type) will be reported once in 24 hours.
The xUML Service Monitor allows further customization of the monitoring service per exception, like custom notification or defining different recipients for certain errors. This chapter explains how to use the service monitor. Only users with profile xuml_monitor_user are able to use the application.
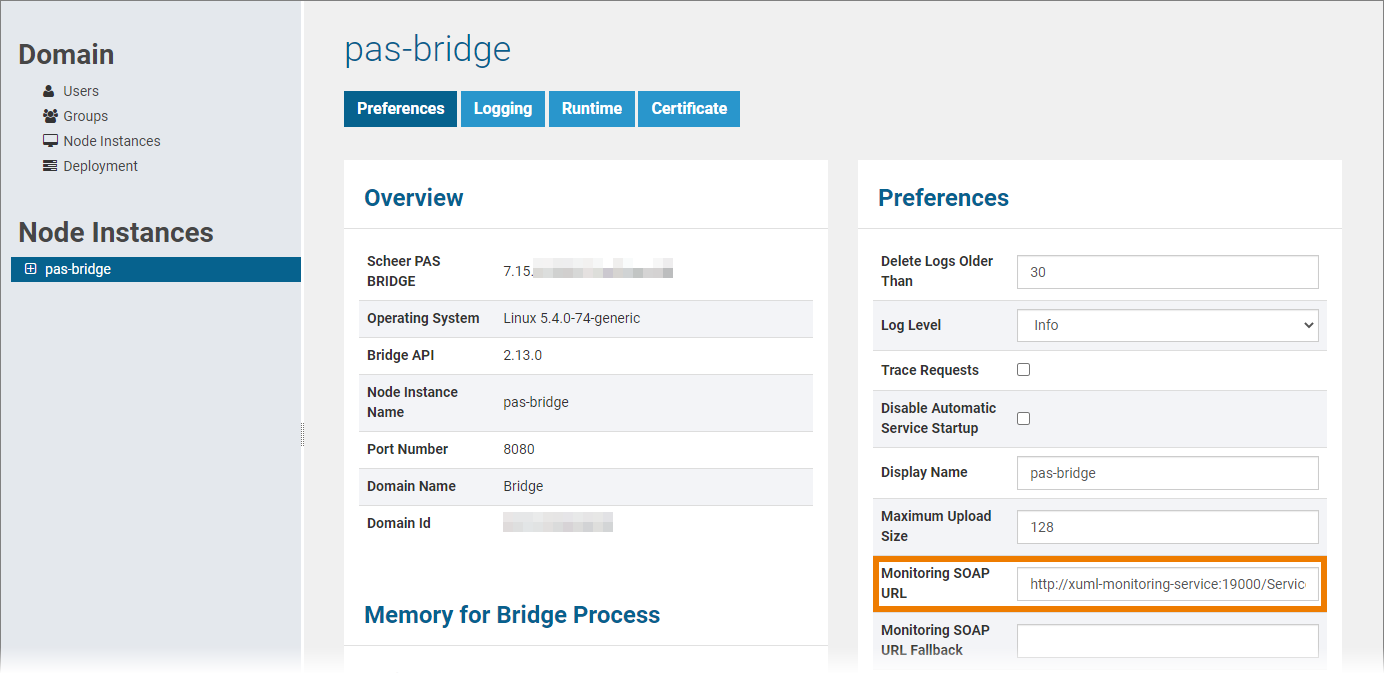
| Before you can use the xUML service monitor, you have to open the integration component (Bridge) and enter the URL for SOAP monitoring:
|
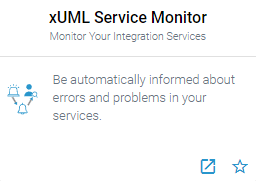
| You can access the xUML service monitor via the corresponding tile in the Scheer PAS Portal. |
| If you click on the service monitor tile, the application will open within the portal. |
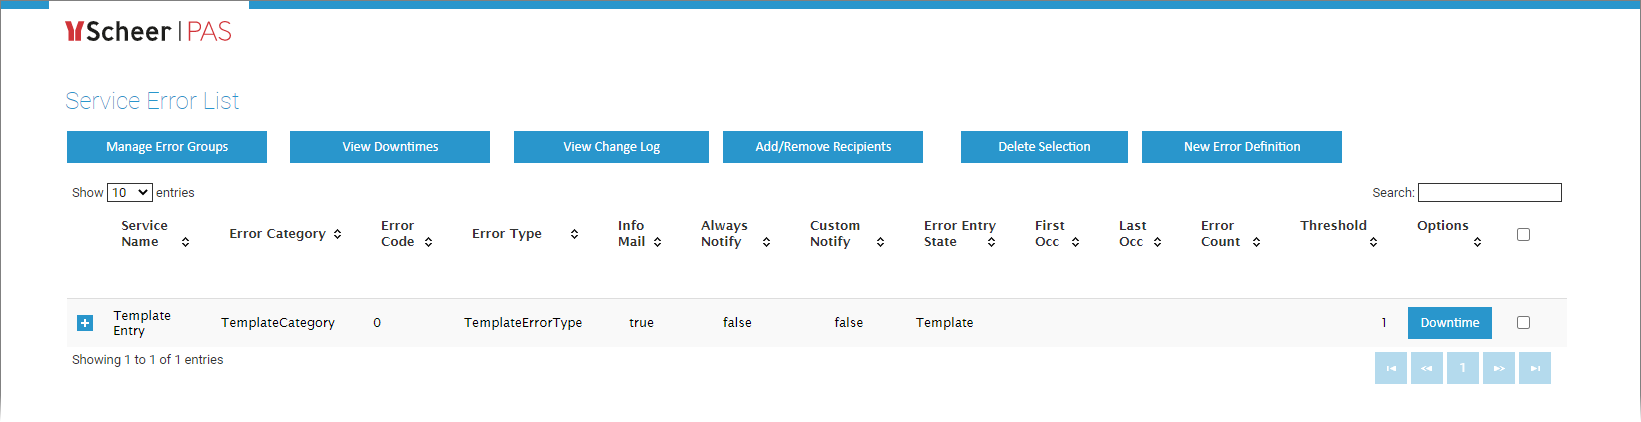
| You can also open the service monitor in a separate browser tab. To do so, use the icon |
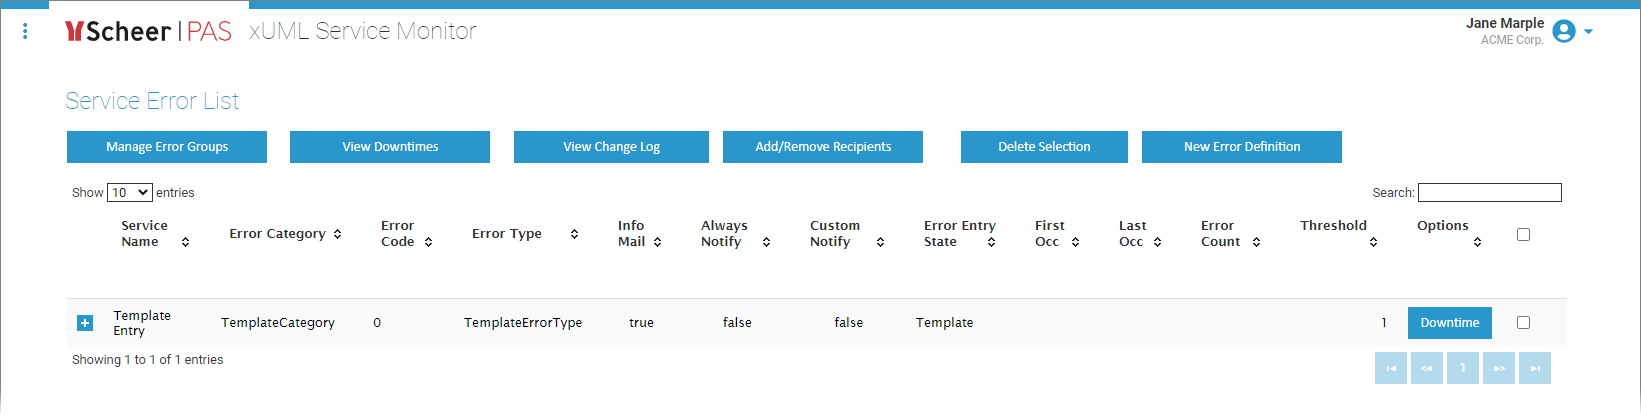
Overview on the xUML Service Monitor Start Page
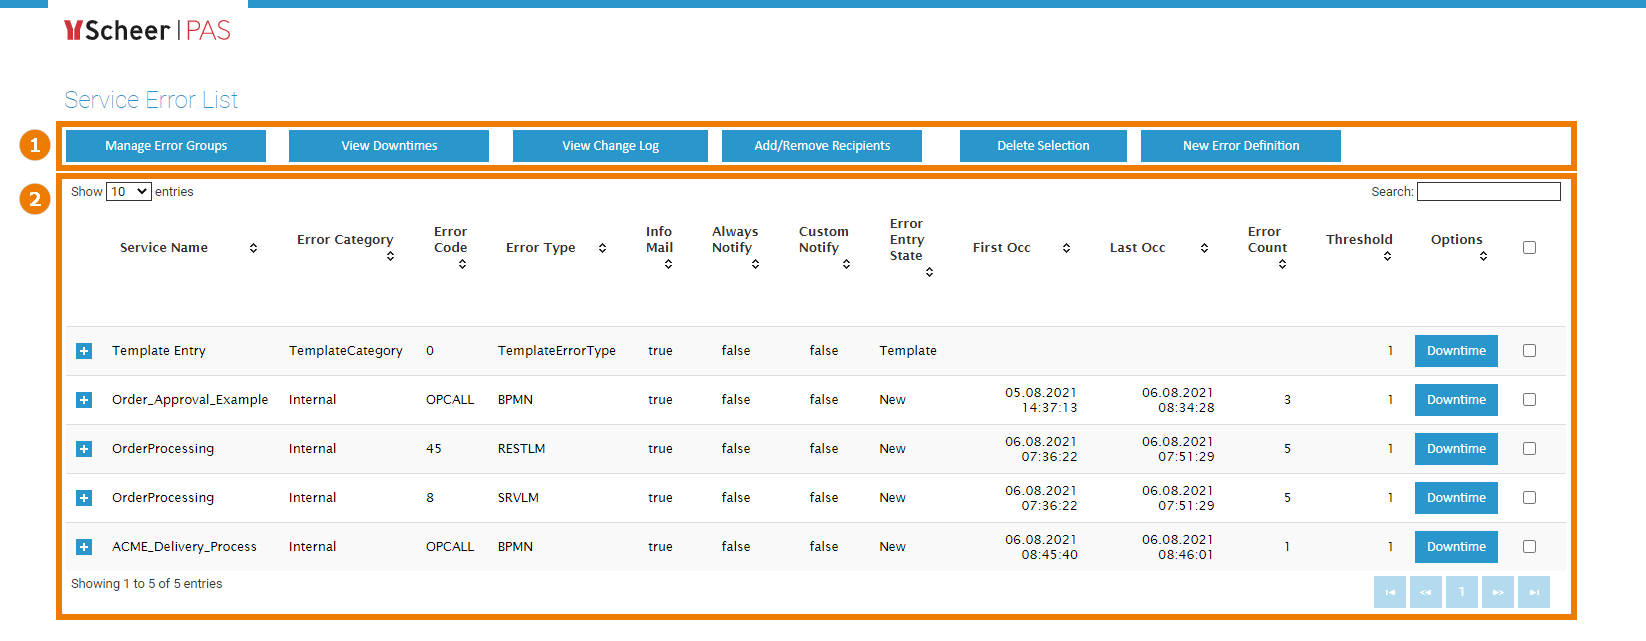
The process monitor start page consists of two sections:
|
|
On this Page:
Related Pages:
Related Documentation:
For usage of monitoring service in a stand-alone Bridge:
Overview
Content Tools