Page History
| Otp |
|---|
...
| Multiexcerpt | ||
|---|---|---|
| ||
The Dashboards are the interfaces where you can inspect the details of processes and services, that have been collected by the Data Collector services. |
Accessing the Dashboard UI
You can find the Dashboards home page at http://<your server name>:19902/
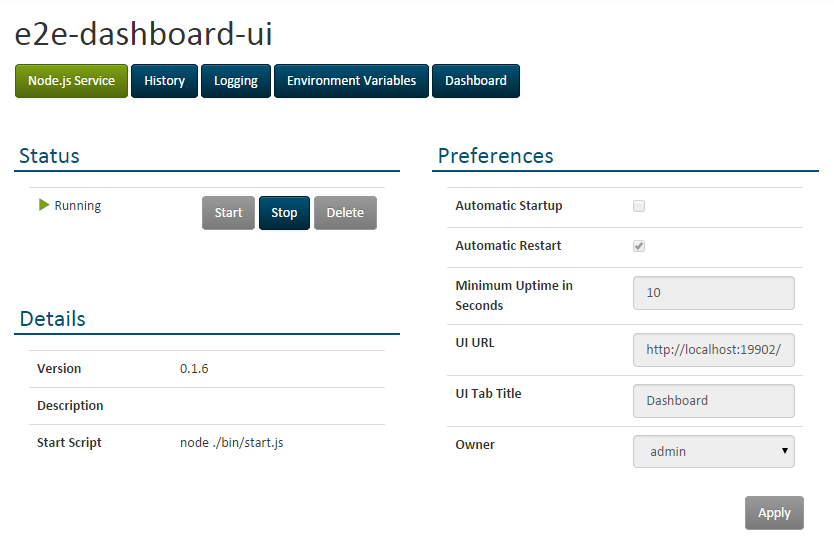
You can also use it as an embeded UI in the E2E Bridge Console:
- Open the E2E Console and go to Node.js Services > e2e-dashboard-ui.
- Configure UI URL and UI Tab Title as shown in the screenshot.
- Click on the extra tab Dashboard.
Figure: Accessing the Dashboards User Interface via the E2E Bridge
| Panel | ||
|---|---|---|
| ||
|
Overview
Content Tools