Once an API is published and is being consumed at runtime, metrics information about that usage is recorded in OpenSearch. For each request, various pieces of information is stored, including but not necessarily limited to the following:
- Request start and end times
- API start and end times
- Resource path
- Response type (success, failure, error)
- API info (org id, id, version)
- Client App info (org id, id, version)
You can access these metrics through the API Management UI, or you can analyze the data using the Log Analyzer. API Management provides some basic, predefined metrics, the Log Analyzer is a reporting tool that lets you define your own reports on base of the OpenSearch data.
Metrics in the API Management UI
In API Management, some basic metrics based on API data and based on client data are available through the UI.
API Metrics
This tab is only visible for published APIs. Navigate to tab Metrics in the APIs section of API Management to display basic metric information about the API. Once an API has been used, you can use the Metrics tab to view basic analytics information and to figure out, how often the API has been used and when. PAS 22.1 For more elaborated metrics, have a look at the Log Analyzer which offers a default dashboard visualizing API Management insights. You can adapt the presentation of the data by selecting from the following options: Option Select one of the pre-defined time ranges: Click Refresh to update the page and load the latest data.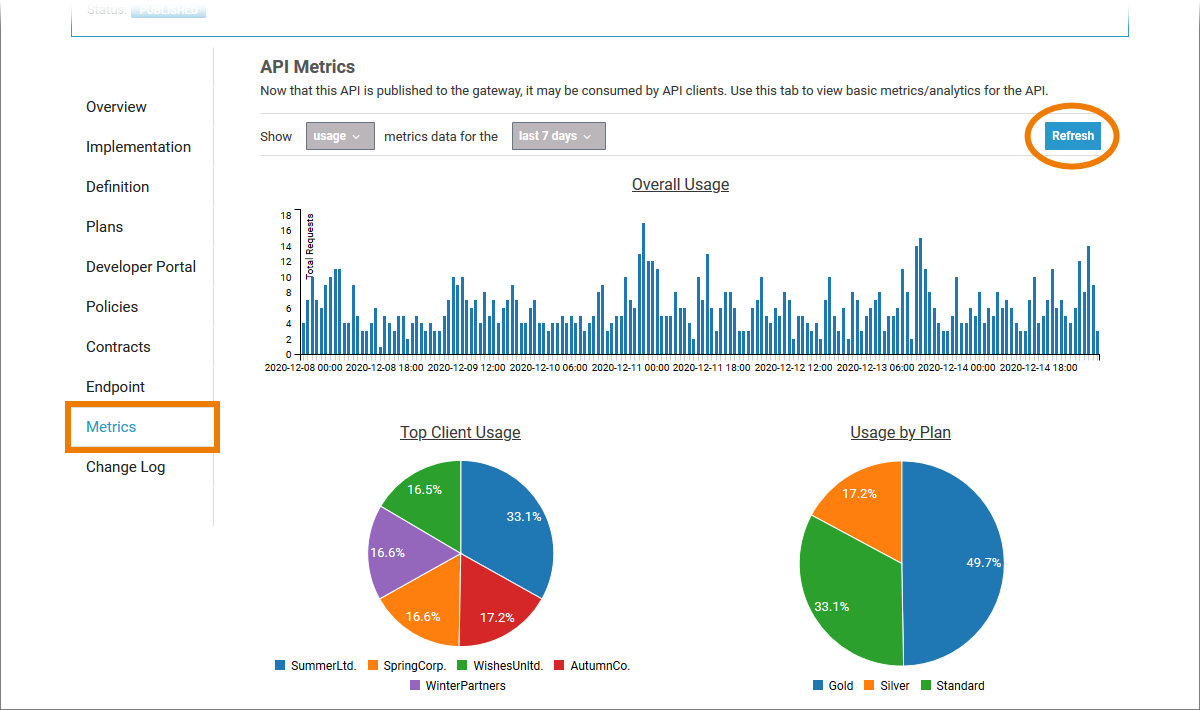
Description Allowed Values Type of Metric Select the type of metric you want to see. usage Show the count of requests per date (default). response type Show the count of requests per response type (success, failed, error). Time Range
Client Metrics
This tab is only visible for registered clients. Navigate to tab Metrics in the Clients section of API Management to display metrics information about the client. Once a client has consumed an API, you can use the Metrics tab to view basic analytics information: PAS 22.1 For more elaborated metrics, have a look at the Log Analyzer which offers a default dashboard visualizing API Management insights. You can adapt the presentation of the data by selecting from the following options: Type of Metric Select one of the pre-defined time ranges: Click Refresh to update the page and load the latest data.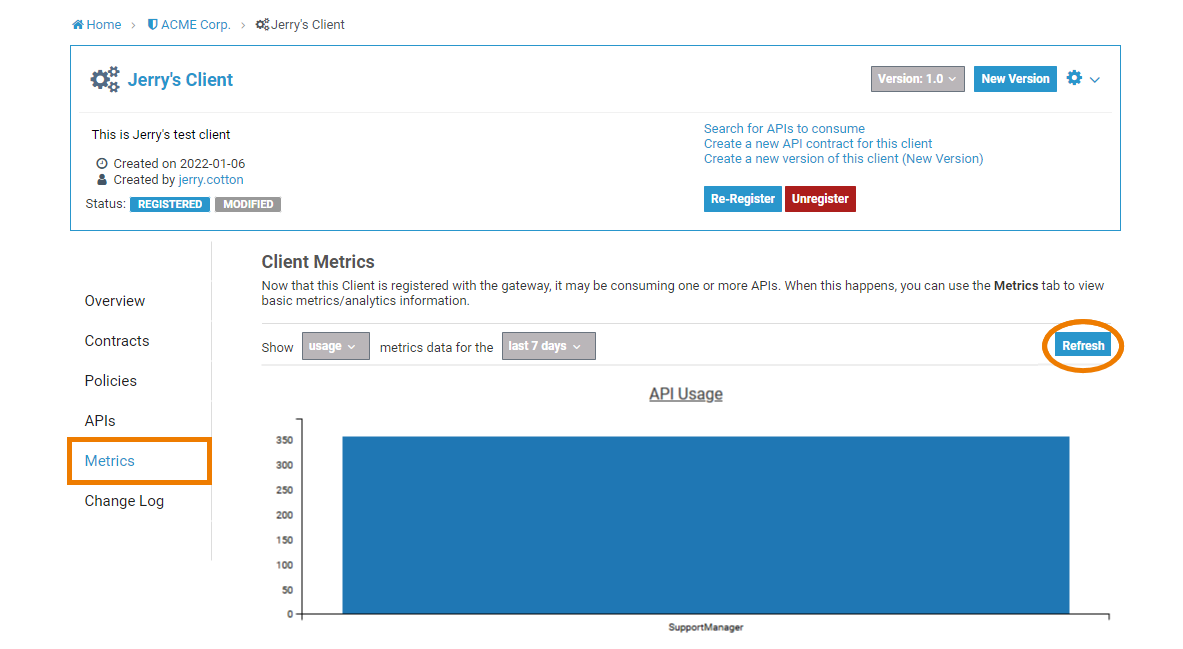
Option Description Allowed Values Select the type of metric you want to see. usage Show the count of requests per date (default). response type Show the count of requests per response type (success, failed, error). Time Range
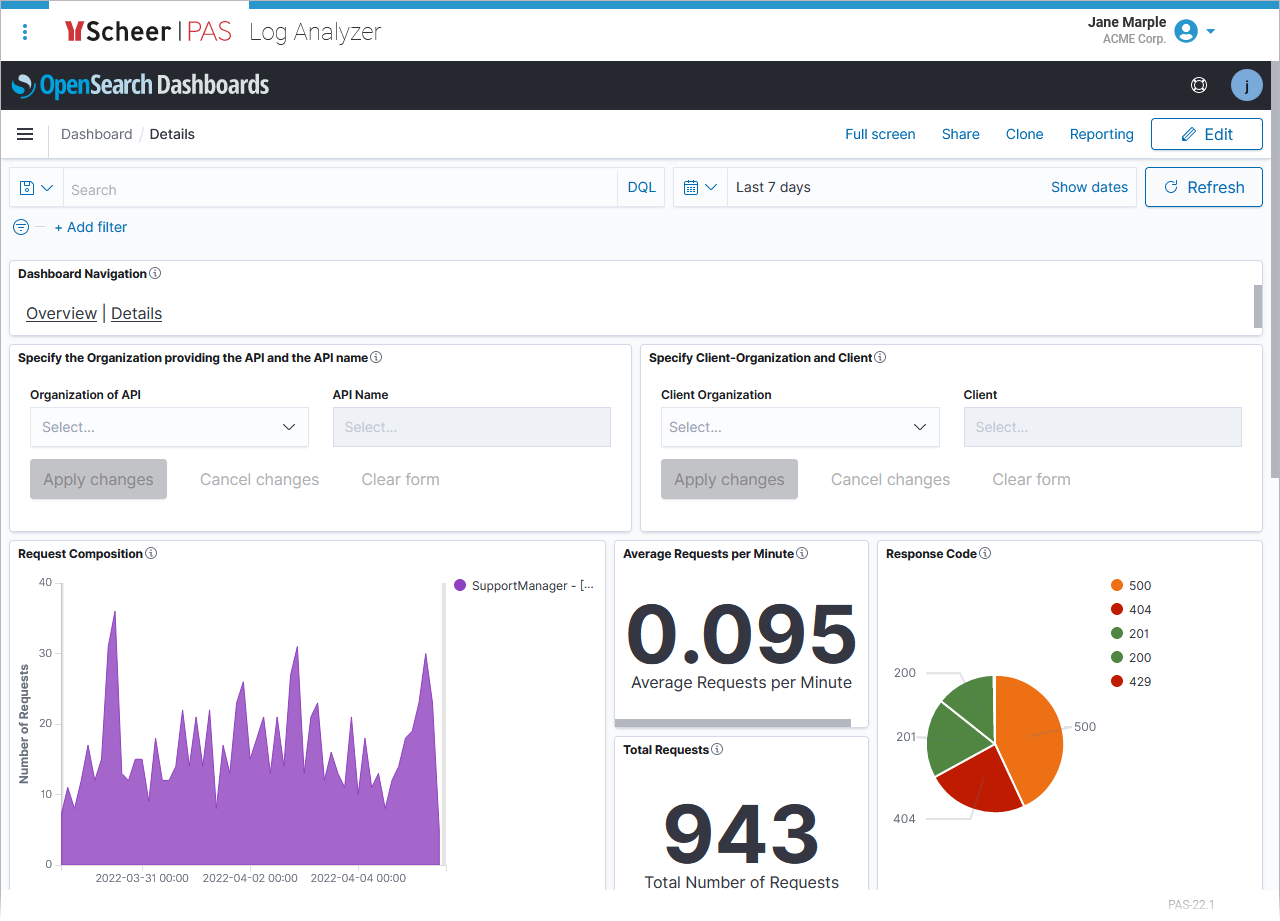
Metric Reports Using the Log Analyzer
| The log analyzer is an analytics and visualization tool designed to work with OpenSearch. With the log analyzer you can search, view, and interact with data stored in OpenSearch indices. You can perform advanced data analysis and visualize your data in a variety of charts, tables, and maps. The Scheer PAS Log Analyzer already contains some default dashboards for API Management users. For more information about the log analyzer, refer to the Administration Guide > Analyzing Platform Logs. The log analyzer is based on OpenSearch, for detailed information, refer to the Official OpenSearch Documentation. |
On this Page:
Overview
Content Tools