The Trace Analyzer features tracing through the execution path of a service. To do that, you need to import the service description first.
Get the Service Repository
Export the service repository from the Designer as described on Controls Panel > Export Compiled Service. Alternatively, you can download the repository from the integration component (Bridge) if the service in question has been deployed to the integration component (Bridge).
This guide uses the solution of the Designer tutorial 1 as an example. The repository file can be downloaded from our documentation.
Import the Service Repository
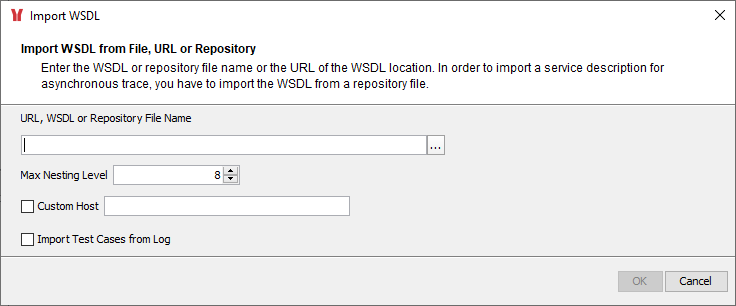
Select Import > Import WSDL from the Analyzer menu. The Import WSDL dialog opens:
Generally, the Analyzer can import
a WSDL file (.wsdl)
a URL providing the WSDL file
a WSDL file (.wsdl) in combination with a bridgeserver log file (.log)
- an xUML service repository file (.rep)
In the context of the Designer, we are using this last option.
Selecting the File
If you have the xUML service repository file on hand that you want to import, enter the file name or click  to open a file browser to select a file from your local system. In the file chooser dialog, navigate to the folder containing the repository file.
This guide uses the solution of the Designer tutorial 1 as an example. The repository file can be downloaded from our documentation.
Confirm the import of the selected repository by clicking OK.
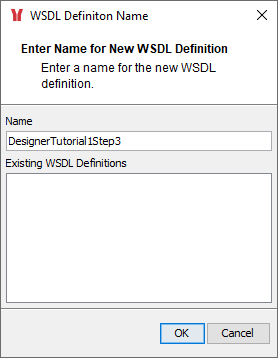
| Next, you may enter a descriptive name for the imported service definition. Existing definitions from earlier imports are listed in the lower text box for orientation. You can also update a description you have imported earlier by selecting it from the list of existing definitions. |
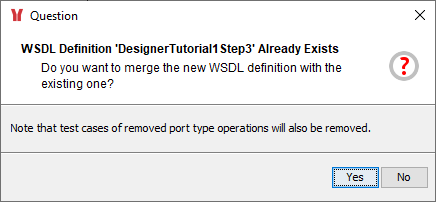
| If you enter an existing definition, you will get the warning, that the data from the earlier import might get overwritten. In case the new repository has e.g. some resources removed, these resources will be deleted from Trace Analyzer, too, including all current traces. |
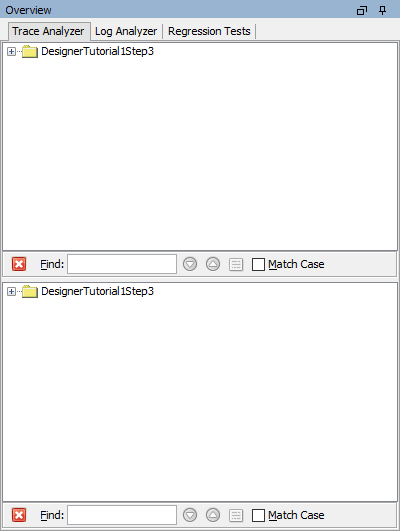
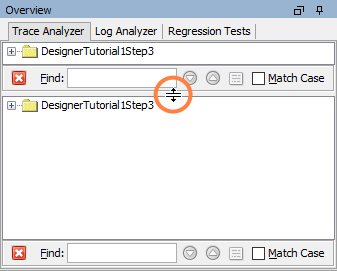
| The imported service description has been saved to the Trace Analyzer. You can now connect selected service resources to a deployment of the service and activate trace as described on Connecting to an xUML Service. The Trace Analyzer is divided into two parts:
You can drag the border between these two parts and expand the lower section at the expense of the upper section:
|
Import Options
You can use the WSDL importer with the following options:
| Option | Description | |
|---|---|---|
| Maximum Nesting Level | The import of the service description can be controlled by a maximum nesting level. The maximum nesting level specifies the maximum depth of the WSDL structure to be considered by the Analyzer. Elements on a level deeper than specified are not imported. | |
| Custom Host | You can replace the service location coming from the WSDL by a custom host. | |
| Import Test Cases from Log | If you have a bridgeserver log file (in addition to the corresponding WSDL file), that contains logged service calls, you can import these service calls as test cases into the Trace Analyzer. |
On this Page:
Related Documentation:
Overview
Content Tools