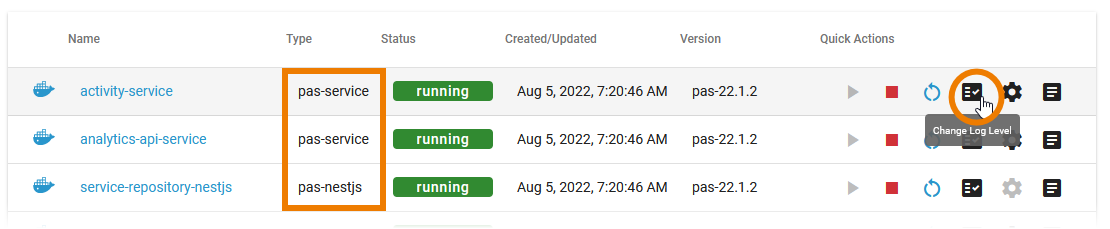
In the administration application you have the possibility to change the log level for a Docker container. The functionality is currently available for the following service types:
- pas-nestjs (= PAS services based on NestJS)
- pas-service (= PAS applications without UI)
| You have two options to open the input form where you can change the log level:
|
|
Changing the log level varies for the different service types. The details are explained below. |

Default Retention Time of Log Files
The following retention times are valid for log files of your PAS installation:
- Container logs: Log files inside all containers are deleted after 7 days.
- Log Analyzer (OpenSearch) logs:
- Single cluster: Log files are deleted after 14 days.
- High Availability cluster: Log files are deleted after 30 days.
- Integration (Bridge) logs: The default retention time for Bridge logs is 30 days. This is configurable in the UI, refer to Integration Platform User's Guide > Node Instance Preferences.
Log Level for Service Type pas-nestjs
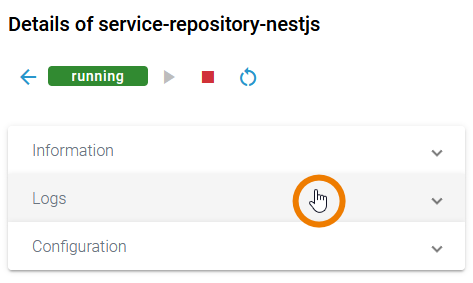
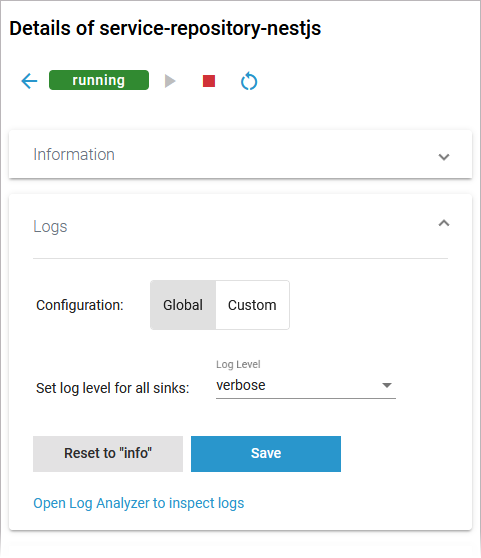
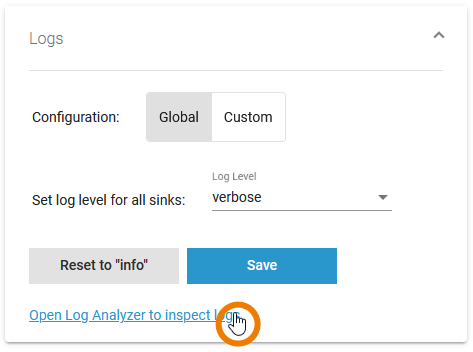
| On the details page of a pas-nestjs service, scroll down to section Logs and expand the section. |
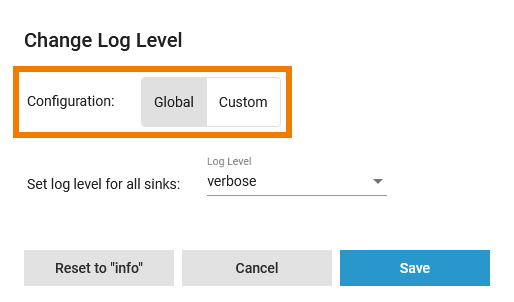
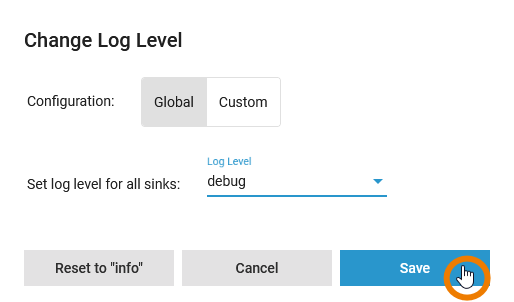
| If you open the pop-up window via the quick actions, you have the same options for the Configuration of the logs:
|
| GlobalIn the global configuration, you set the log level for all sinks. Available log levels are:
If you have turned down the log level to see more logs, do not forget to turn it up again after you have finished your analysis. The performance of the system may deteriorate if a lot of logs are stored for a long time. The log level settings are reset to its default value during a restart of the service. |
|
|
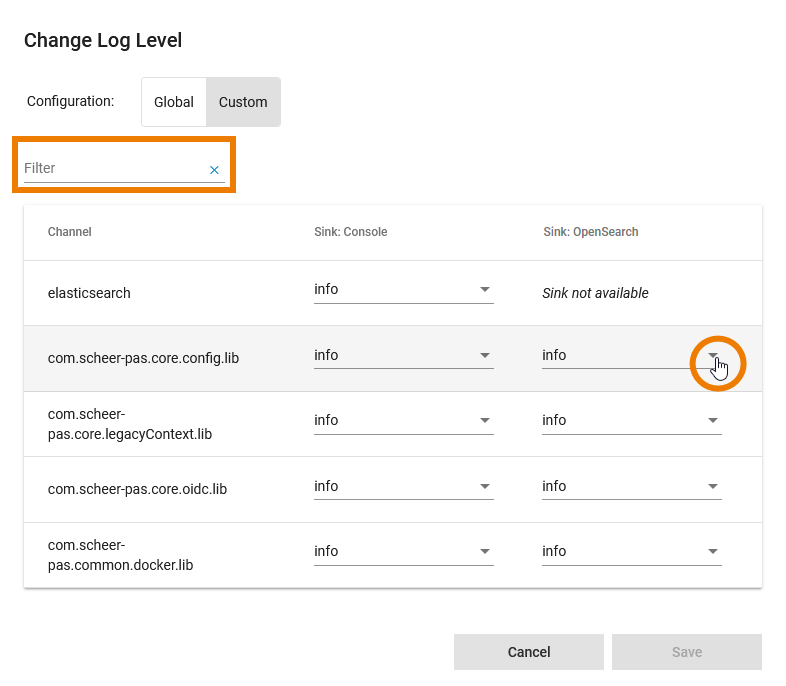 | Custom The Custom tab allows a fine grained setting of the log level. For each channel, you can set the log level for the different sinks:
Use the Filter to show only the channels you are looking for. |
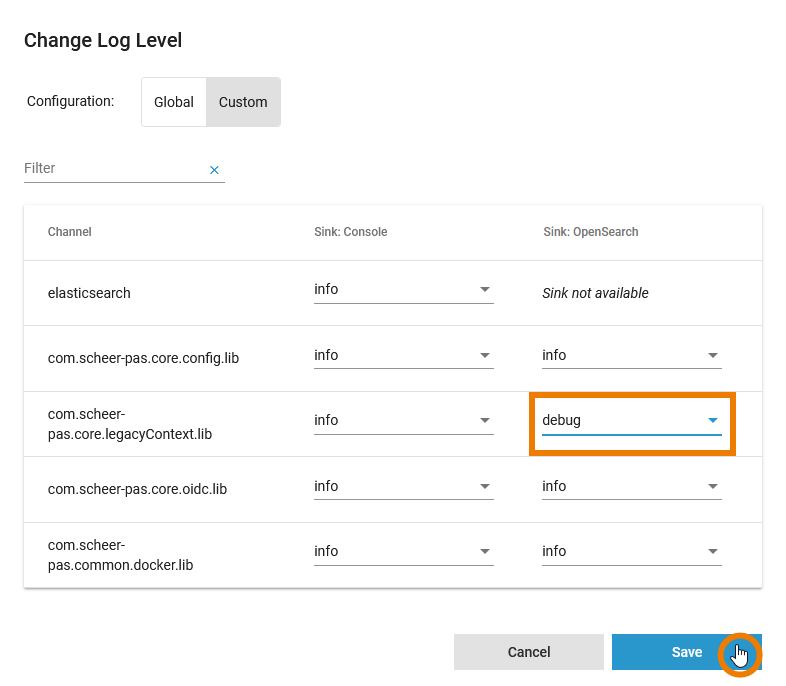 | In the Custom tab, option Save will only be enabled when at least one of the entries has been changed. |
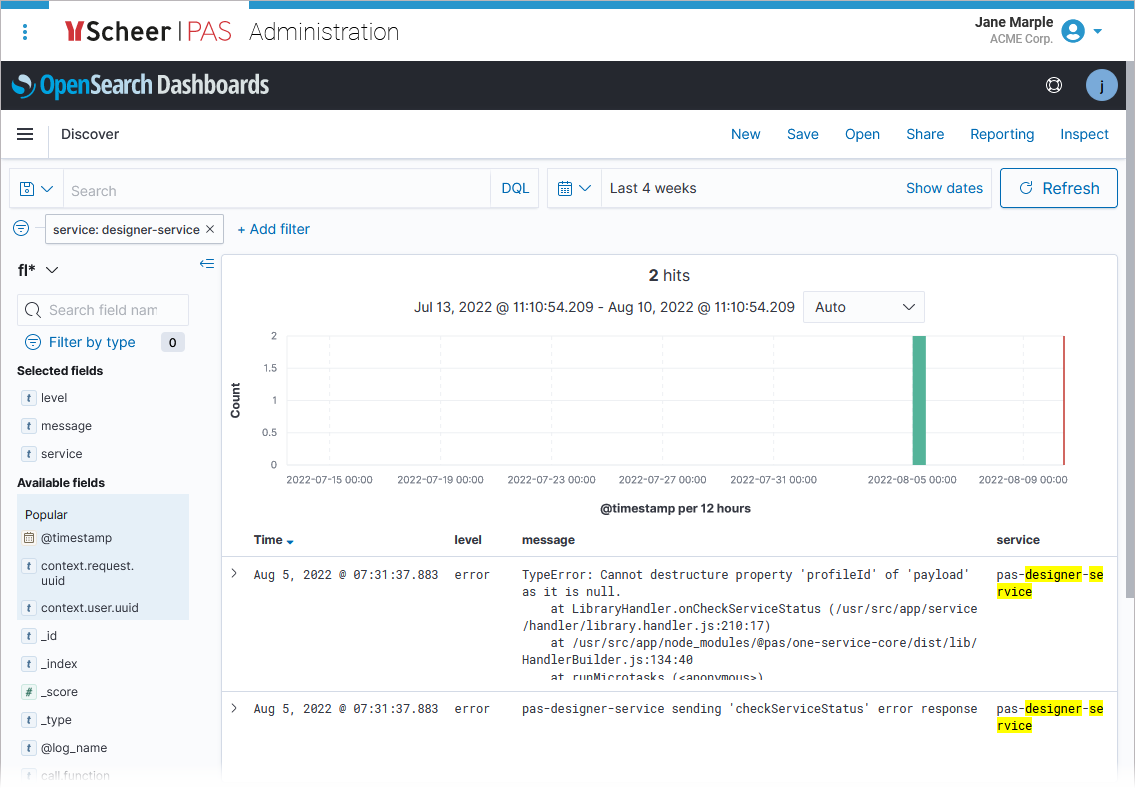
| In the Logs section of the service details page, you can also use the link Open Log Analyzer to inspect logs. |
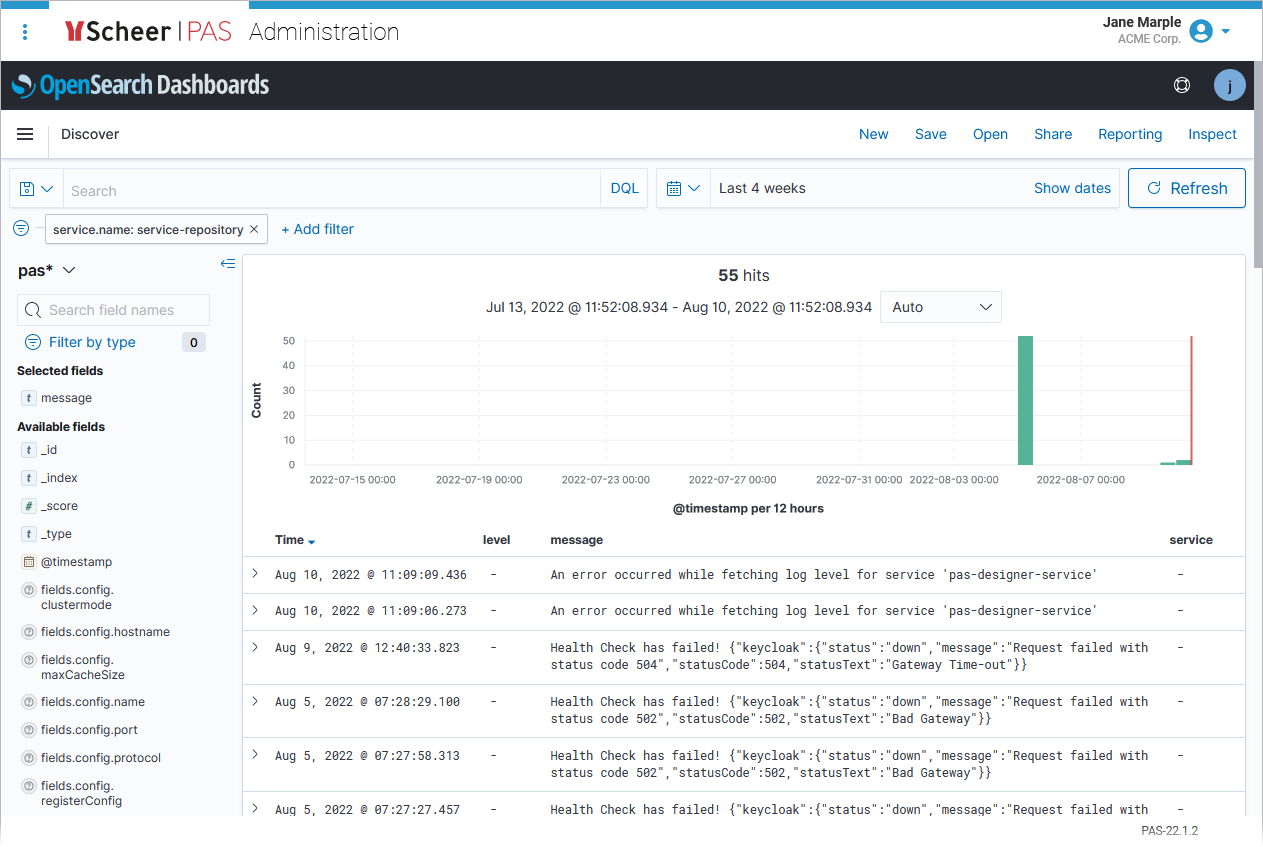 | The Log Analyzer will open, showing you the corresponding logs. For more information about the Log Analyzer, refer to Analyzing Platform Logs. |
Log Level for Service Type pas-service
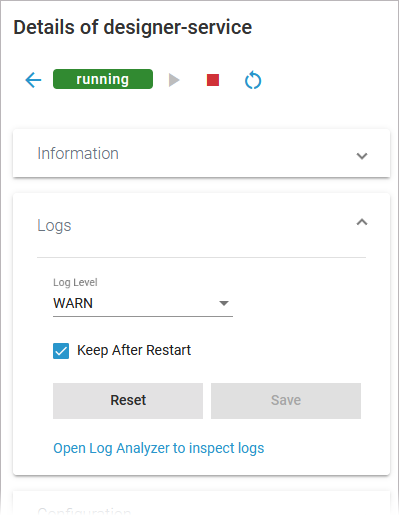 | On the details page of a pas-service, scroll down to section Logs and expand the section. |
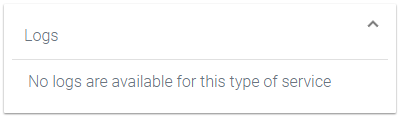
| The Logs section also informs you if there are no logs available for this type of service. |
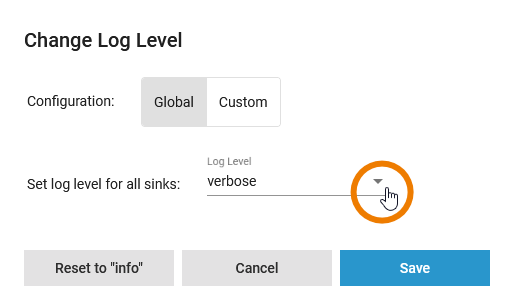
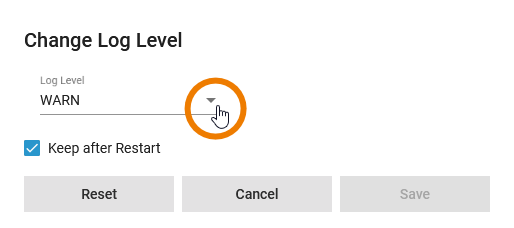
| If you open the pop-up window via the quick action icon, you have the same options to change the log level. Open the drop-down list to select one of the available log levels:
If you have turned down the log level to see more logs, do not forget to turn it up again after you have finished your analysis. The performance of the system may deteriorate if a lot of logs are stored for a long time. The log level settings are reset to its default value during a restart of the service. |
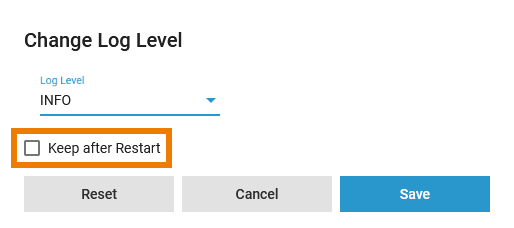
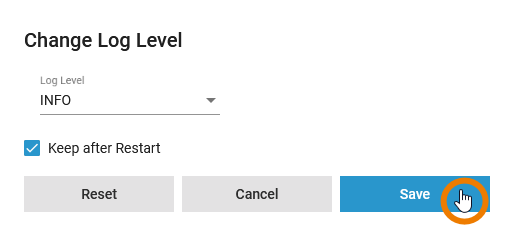
| The chosen log level is kept after a restart of the service. If after a restart of the service you want to return to the previously used log level, disable option Keep after Restart. |
|
|
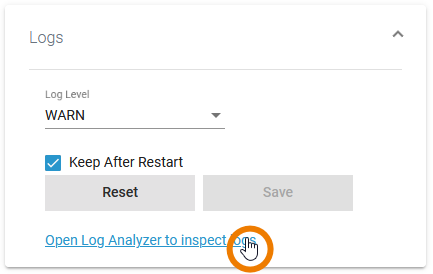
| In the Logs section of the service details page, you can also use the link Open Log Analyzer to inspect logs. |
| The Log Analyzer will open, showing you the corresponding logs. For more information about the Log Analyzer, refer to Analyzing Platform Logs. |
Overview
Content Tools