For test cases running with enabled trace the xUML Runtime collects tracing information. By that, you can browse through a graphical representation of the test case run afterwards.
This graphical representations is displayed on the UML tab.
If you switch to the UML tab, and the test case has not yet been run, a note The test case has not been run yet will be displayed in the information box.
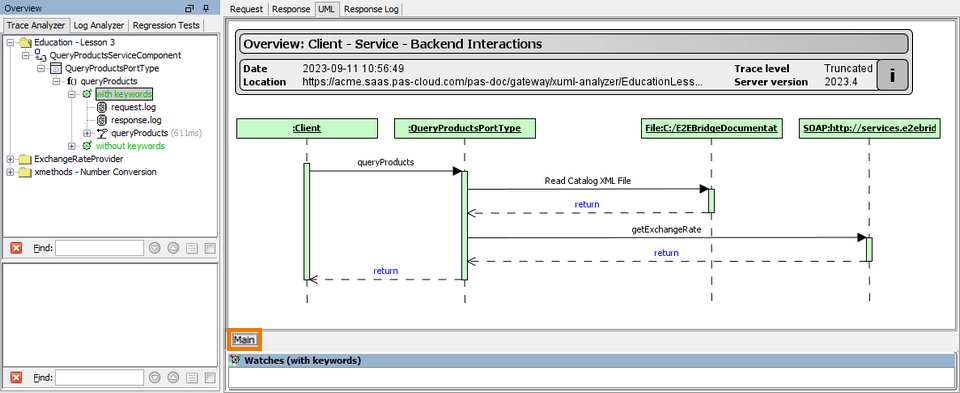
After the test case has run, a sequence diagram with a client, a port type, and backend adapters (if used in the UML diagram) will be displayed on the Main tab.
The sequence diagram visualizes the input and output actions that happened between client and service and backend.
Inspecting the Input and Output Data
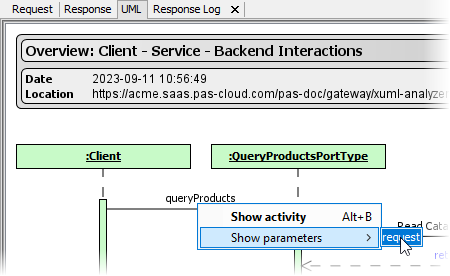
| Right-click the operation name (queryProducts in the screenshot on the left) and select Show Parameters from the context menu. The menu displays a list of all input parameters. In the example above it is only one: request. Select a parameter from the list to add it to the Watches window at the bottom of the UML tab. For more information on the Watches window, refer to Watching Object Values further below. To inspect the output parameter do the same on the return statement. |
Navigating Through the Graphic
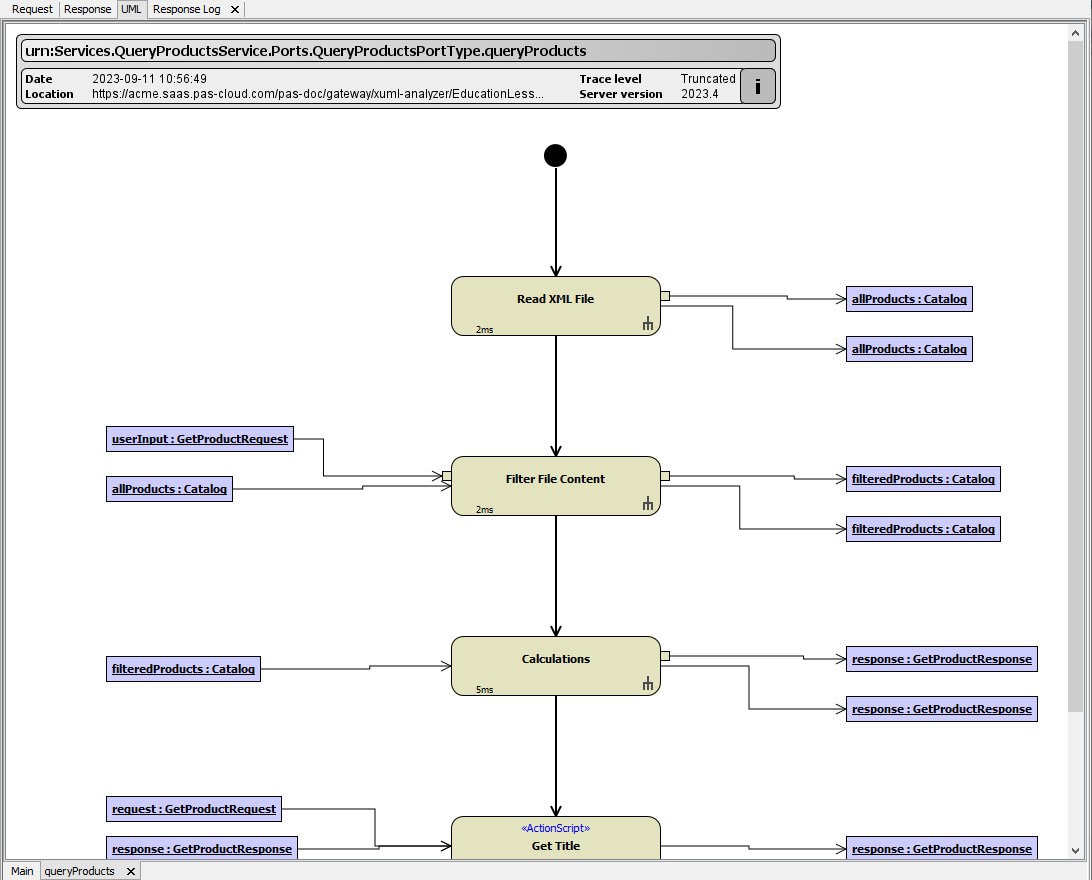
| Use your mouse to navigate through the graphic. While moving your mouse over the UML tab, the mouse cursor changes to a pointing finger on some elements. Click these elements to browse deeper into the execution hierarchy (or select Show activity from the context menu). |

In addition to the Main tab further tabs will open, displaying the execution path through the activity diagram of the selected operation.
Watching Object Values
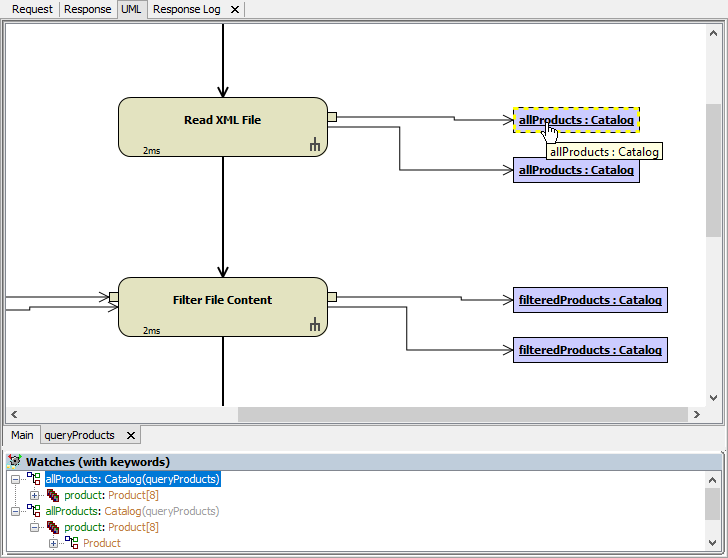
Note the Watches window at the bottom of the UML tab. This window displays objects that you selected for watching. You can add objects to the watches window simply by clicking them.
Watching Array Objects
If an output object contains an array, the list of array elements (items) is displayed in the Watches window, too.
To see the values of array items, expand the nodes in the Watches window.
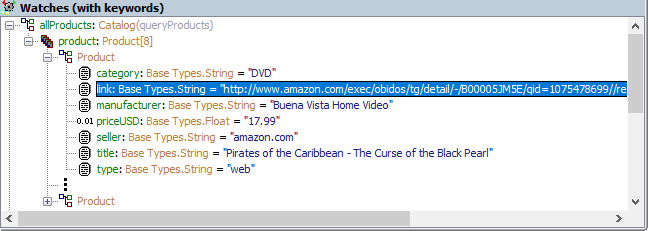
The number of array elements is displayed in parentheses (product:Product[8] ). For each array element, its type (Product) is displayed, too.
In the screenshot above, only the first and last items of the product array is displayed as the trace settings have been set to truncate arrays, blobs and strings (see Modifying the Tracing Settings for more information on the trace settings). The omission of elements is indicated by three vertical dots ![]() .
.
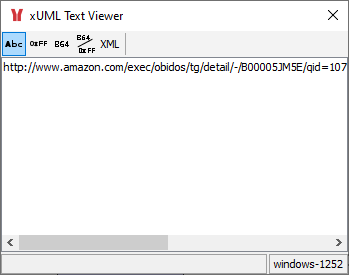
Watching Objects of Base Type
Right-click an attribute of base type and select Show Value from the context menu or double-click the tree item. Now you can have a closer look at its value. The value of the attribute is displayed in detail in a separate window, the Text Viewer.
| By clicking the icons from the ion bar of the window, you can switch between four different presentation formats:
By selecting Copy Value from the context menu, you can copy the corresponding attribute value into the clipboard. |
Watching Objects of Type Blob
Right-click an attribute of type Blob and select Show Value from the context menu or double-click the tree item. Now you can have a closer look at its value. The value of the attribute is displayed in hexadecimal encoding in a separate window, the Blob Viewer.
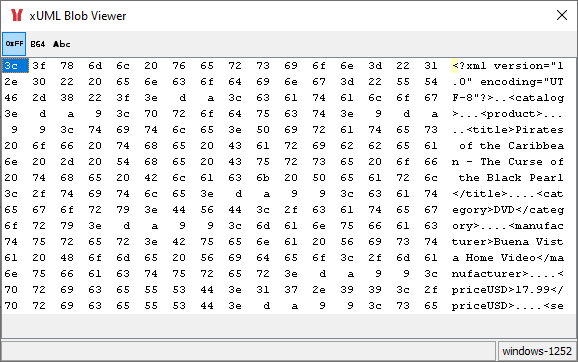
Click the B64 button  to view the blob content in the Base 64 view or the ABC button
  to view it in plain text.
Clearing all Watches
To clear the Watches window just right-click anywhere into the Watches window and select Clear Watch View from the context menu.
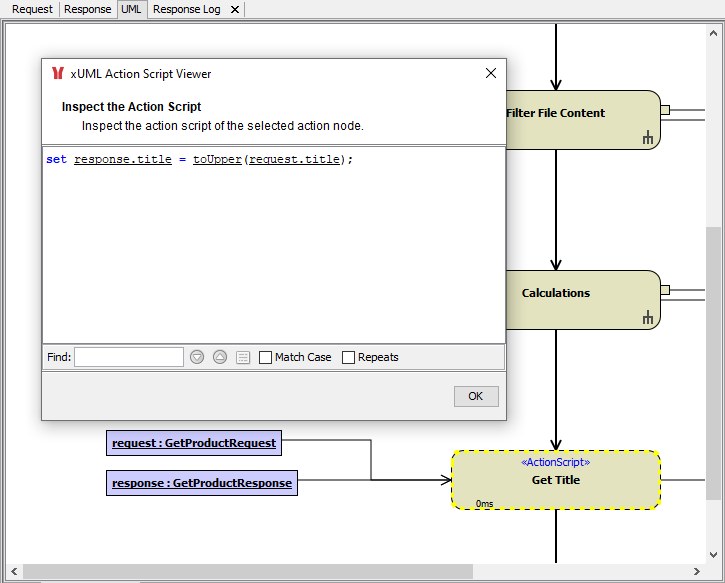
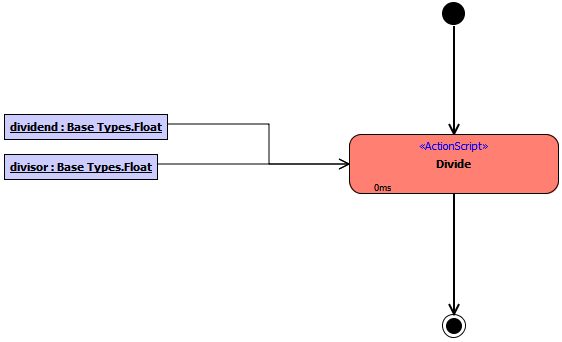
Inspecting Action Script
To view the action script that was executed when running the test case, just click on an action node containing action script. This is indicated by the sterotype <<ActionScript>> on the action node. The action script is displayed in the Action Script Viewer.
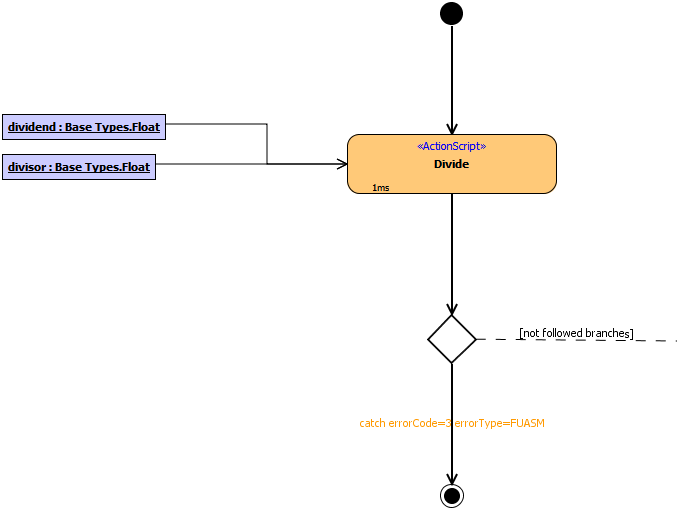
Inspecting Errors
Action nodes where an error has occurred are displayed in red in the UML view of the test.
If an error has been caught in the model, the test case is green. Nevertheless, the caught error branch is displayed in the UML view in orange color:
If you have set your project settings to Ignore Caught Errors, caught errors will only be visible through the color of the branch where they have been caught:
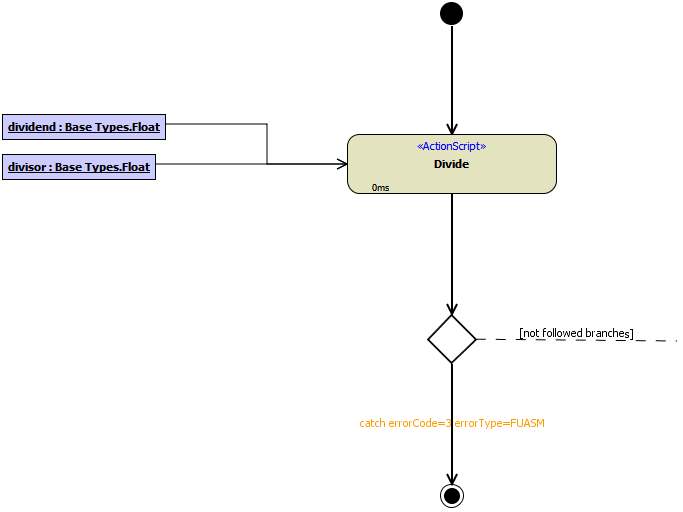
For more information on how to set this option, refer to Creating/Opening a Builder Project.
Overview
Content Tools