To view or edit test case properties select Properties from the context menu of a test case or double-click it.
Modifying General Test Case Information
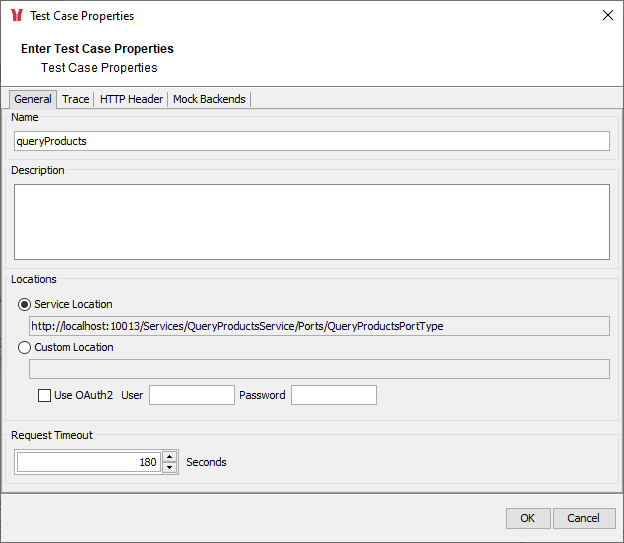
| On the General tab of the test case properties dialog you can change the Name of the test case. Optionally, you may enter a test case Description. This useful to give special information about the test case. The Service Location specifies the path to the deployed xUML service instance, which was read from the WSDL file during import. SOAP requests will be sent to this URL. You can change the service location to a Custom Location and specify a custom xUML service path. Selecting this option, the xUML service path coming from the WSDL file will be ignored. SOAP requests will be sent to this individually defined URL. You can use this for testing a same xUML service running on multiple Bridge instances (e.g. a development instance and a testing instance). WSDL locations are defined per test case. You can set them separately for every test case in the Builder project. If your service is running behind an API Management gateway with Keycloak authentication, check the OAuth2 option and specify valid credentials to be able to access the service. Specify a Request Timeout in seconds (default is 180 seconds). The Analyzer will abort requests running longer than specified.
|
Modifying the Tracing Settings
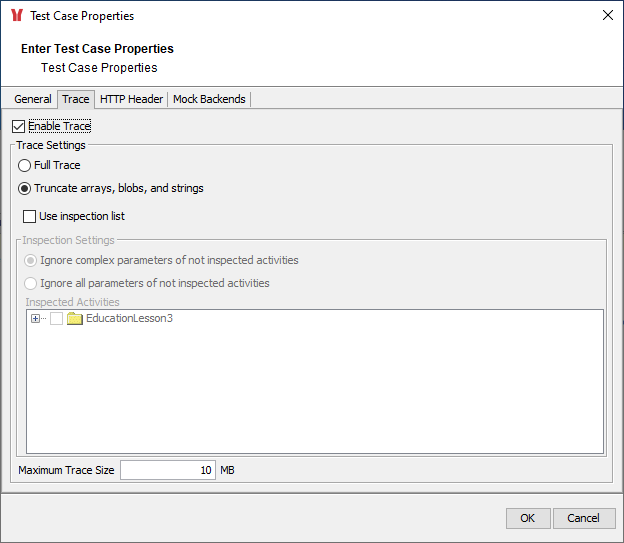
| On the Trace tab of the test case properties you can set the trace options. Select the check box Enable trace, if you want the xUML Runtime to collect tracing information. By that, you can browse through a graphical representation of the test case run afterwards. This implies that this option is only valid on services that are running on a Bridge. If you deselect check box Enable trace , no tracing information will be collected by the xUML Runtime. You can choose two Trace Levels .
In order to avoid memory problems on the system running the Trace Analyzer, you can limit the Maximum Trace Size. The default is specified as 10 MB. The minimum value is 1 MB. |
Using the Inspection List
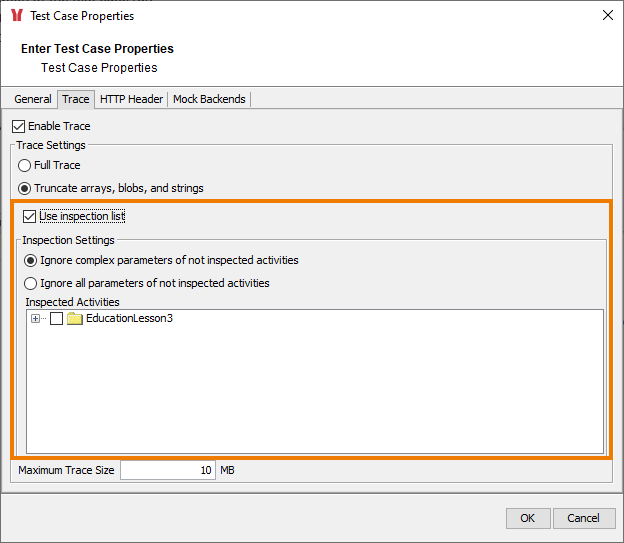
| To use the inspection list feature, you have to import the WSDL from repository. To request trace information for a specific activity, select the checkbox Use inspection list and select the activities to be considered from the containment tree of the Trace Analyzer (see picture below). However, per default, some debugging information for all activities, even the ones you did not put on the inspection list, is still available: values of input and output objects, which are of base type. Complex parameters (values of objects of complex type) of not inspected activities are always ignored (default option Ignore complex parameters of not inspected activities). If you only want to inspect the activities on the list and do not even need values of base types, select the second option Ignore all parameters of not inspected activities . Inspected activities can be removed from the inspection list by clicking the Remove button. Clicking the View button, will highlight the selected item in the containment tree. |
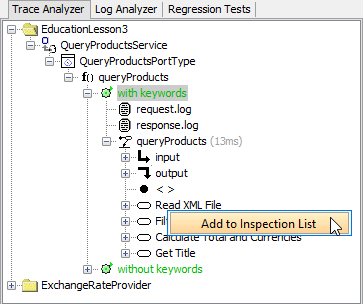
| On the right, you can see how to add an activity to the inspection list. Select the activity and select Add to inspection list from the context menu. The selected activity will get marked by an eye symbol ( You can add activities and action nodes to the inspection list. |
Extending the HTTP Header
The HTTP Header Editor allows you to add any HTTP headers, and assists with basic authentication. This is an important feature to emulate security settings, for instance, to authenticate a user directly by sending a Remote-User header, or to provide some header variables to simulate certificate variables like organization units, etc.
The following HTTP header variables can be added respectively overwritten with the Header Editor:
| HTTP Header Field | Default Value |
|---|---|
| User-Agent | SOAPTestTool/1.0 (<java.vm.name>/<java.vm.version>) |
| X-Bridge | NoErrorReturn |
| Cache-Control | no-cache |
| Pragma | no-cache |
| Host | <host:port> |
| Accept | text/html, image/gif, image/jpeg, *; q=.2, */*; q=.2 |
| Proxy-Connection | keep-alive |
The following standard HTTP header fields cannot be overwritten and will be ignored if set via the header editor:
| HTTP Header Field | Default Value |
|---|---|
| Content-Type | text/xml; charset=utf-8 |
| Content-Length | <actual content length> |
| SOAPAction | <soap action> |
Click Add and Remove to manage the HTTP header fields.
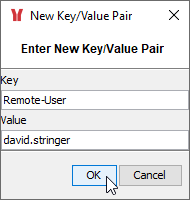
| In the New Key/Value Pair dialog, enter the key, for instance, Remote-User , and the value, for instance, david.stringer . This will add a header variable Remote-User: david.stringer to the SOAP request sent with this test case emulating a user authenticated by a proxy. |
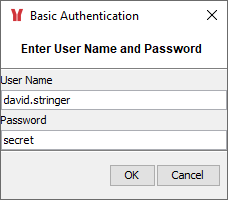
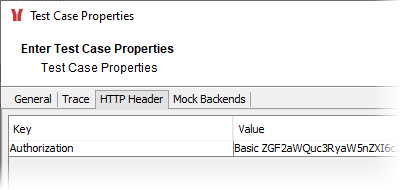
| If you want to send an Authorization HTTP header variable with the current test case to perform basic authentication with a proxy, use the Edit Basic Authentication button and enter User Name and Password. |
| In this way the password will only be displayed in an encrypted way. If this test case is run, the SOAP request will contain the Authorization HTTP header with encoded user name and password. A transcript of the current SOAP request can be viewed on the Request Log tab of the Trace Analyzer. |
POST /Services/QueryProductsService/Ports/QueryProductsPortType HTTP/1.1
Authorization: Basic ZGF2aWQuc3RyaW5nZXI6c2VjcmV0
X-Bridge: NoErrorReturn
Request-ID: queryProducts_1348555600148
SOAPAction:
User-Agent: SOAPTestTool/1.0 (Java HotSpot(TM) Client VM/16.0-b13)
Host: acme.saas.pas-cloud.com
Content-Length: 869


<env:Envelope xmlns:env="http://schemas.xmlsoap.org/soap/envelope/"

[...]

</env:Envelope>
On this Page:
Related Pages:
Related Documentation:
Overview
Content Tools