MultiExcerpt named kibana was not found -- Please check the page name and MultiExcerpt name used in the MultiExcerpt-Include macro
To use Kibana, you need to start all API Management containers, including Kibana.
If API Management is still running, shut it down first:
docker-compose down
Then, start all API Management containers:
docker-compose up
Setup Procedure
During API Management installation you have already enabled Kibana for your installation. To use it for your metrics, you only need to configure the Elasticsearch index that is used for Kibana:
- Login to Kibana at https://<my API Management URL>:<my Kibana port>, e.g. https://api.acme-corp.com:8446.
You will see an index-pattern error. Select menu item Management from the menu bar on the left to configure an index-pattern.
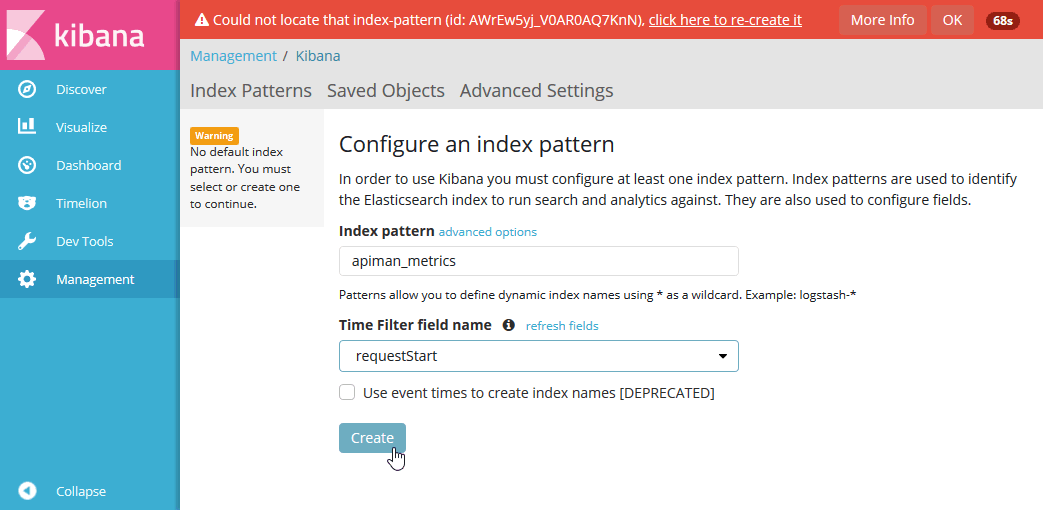
- Enter apiman_metrics as name of the pattern:
- Select requestStart from the dropdown box as name of the Time Filter field.
- Click Create.
- Grant users access to Kibana by assigning them role kibanauser. Refer to Managing Roles for more information on this.
For more information on creating reports with Kibana, refer to the Kibana User Guide. On page Metrics you can find a short introduction to API Management metrics and some Kibana templates to download.
Overview
Content Tools