On this Page:
All users may view details of a Java service. Expand the tree below a node instance in the Node Instances section of the navigation. Then, navigate to a Java service entry below the sub-navigation item Java. The tab Java Service is initially displayed.
Figure: Java Service Details
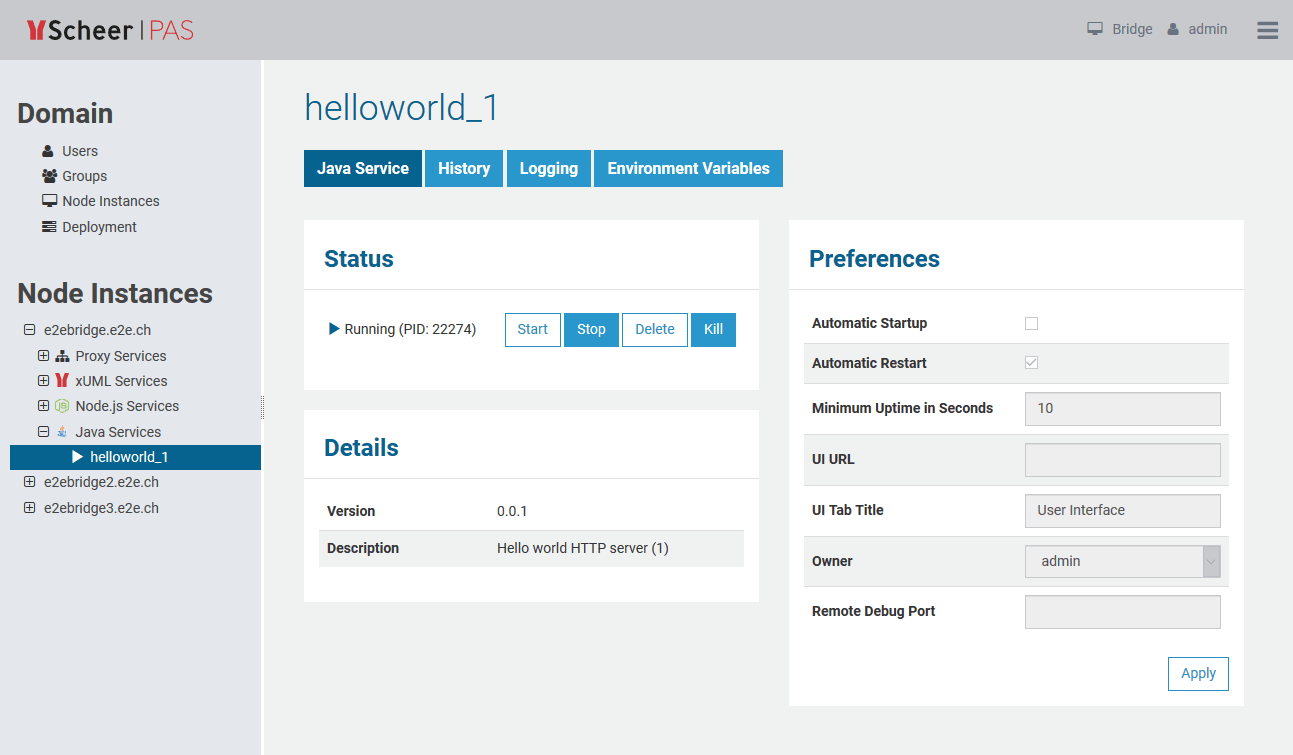
Status Information
In the Status Information section, the status of the Java service (Running or Stopped) is displayed.
Service Details
In the Overview section, the following information is displayed:
| Element | Description | Origin (MANIFEST.MF) |
|---|---|---|
| Version | Version of the Java service as specified in package.json. | E2E-Service-Version |
| Description | Description of the Java service as specified in package.json. | E2E-Service-Description |
Preferences
In the Preferences section, the following preferences can be modified:
| Option | Description |
|---|---|
| Automatic Startup | MultiExcerpt named automatic_startup was not found -- Please check the page name and MultiExcerpt name used in the MultiExcerpt-Include macro |
| Automatic Restart | MultiExcerpt named automatic_restart was not found -- Please check the page name and MultiExcerpt name used in the MultiExcerpt-Include macro Also consider the implications of Minimum Uptime in Seconds when setting this option. |
| Minimum Uptime in Seconds | MultiExcerpt named minimum_uptime was not found -- Please check the page name and MultiExcerpt name used in the MultiExcerpt-Include macro |
| UI URL | Specify the URL of the user interface of the Java service. It then will be displayed as an additional tab within the E2E Bridge and you can access it directly via the Bridge. |
| UI Tab Title | If the Java service has a user interface that is integrated to the E2E Bridge, you can specify the title of the tab here. The default title is User Interface. |
| Owner | MultiExcerpt named owner was not found -- Please check the page name and MultiExcerpt name used in the MultiExcerpt-Include macro |
| Remote Debug Port | If you want to debug your Java service, save the number of the port you want to use for debugging in this field. While starting the service on the E2E Bridge, the port number will automatically be committed to the service and you can attach a Java debugger to this port. |
History
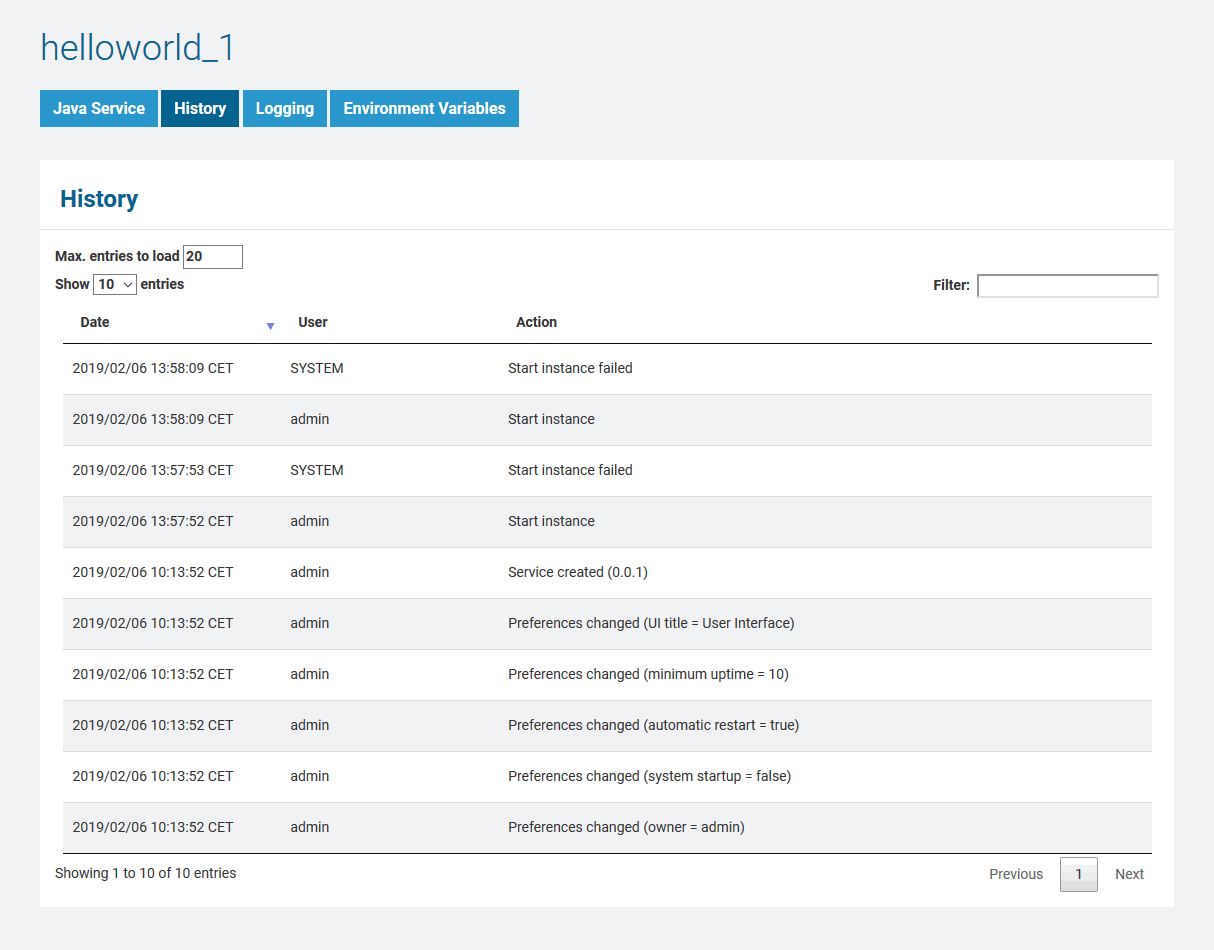
Switch to the History tab to view the history of all user actions that were executed on the selected Java service since its deployment.
In the Java service history all user actions are listed - comprising starting and stopping the service, modification of the preferences, etc. The list is sorted in a chronological order and also shows the user who initiated the action.
The history also lists internal actions, for instance, when the system started or stopped a Java service automatically.
All users have access to the history information.
Figure: Java Service History
Overview
Content Tools