Switch to the Logging tab in the information/working area. All users have access to logged information.
The logged information is categorized as follows:
| Log | Technical Name | Description |
|---|---|---|
| Standard Log | bridgeserver | Contains logging information logged by the Bridge process that is running the selected xUML service. |
| Transaction Log | transaction | Contains transactional logging information logged by the Bridge process that is running the selected xUML service. The logged information is usable for performance measurements or statistical evaluations (how often has the transaction been called, in which context, etc.). |
| Start Log | start | Contains information about the selected xUML service, environment variables, and errors logged by the Bridge process at startup. |
| Stop Log | stop | Contains information about the selected xUML service and errors logged by the Bridge process when stopping it. A stop log is available, if the service could not be stopped regularly but if errors occurred upon stopping, or if the service had to be killed. |
| Custom Logs | <your name> | The Bridge can also display custom logfiles. To be able to access this custom logfiles via the Bridge they must meet the following conditions: |
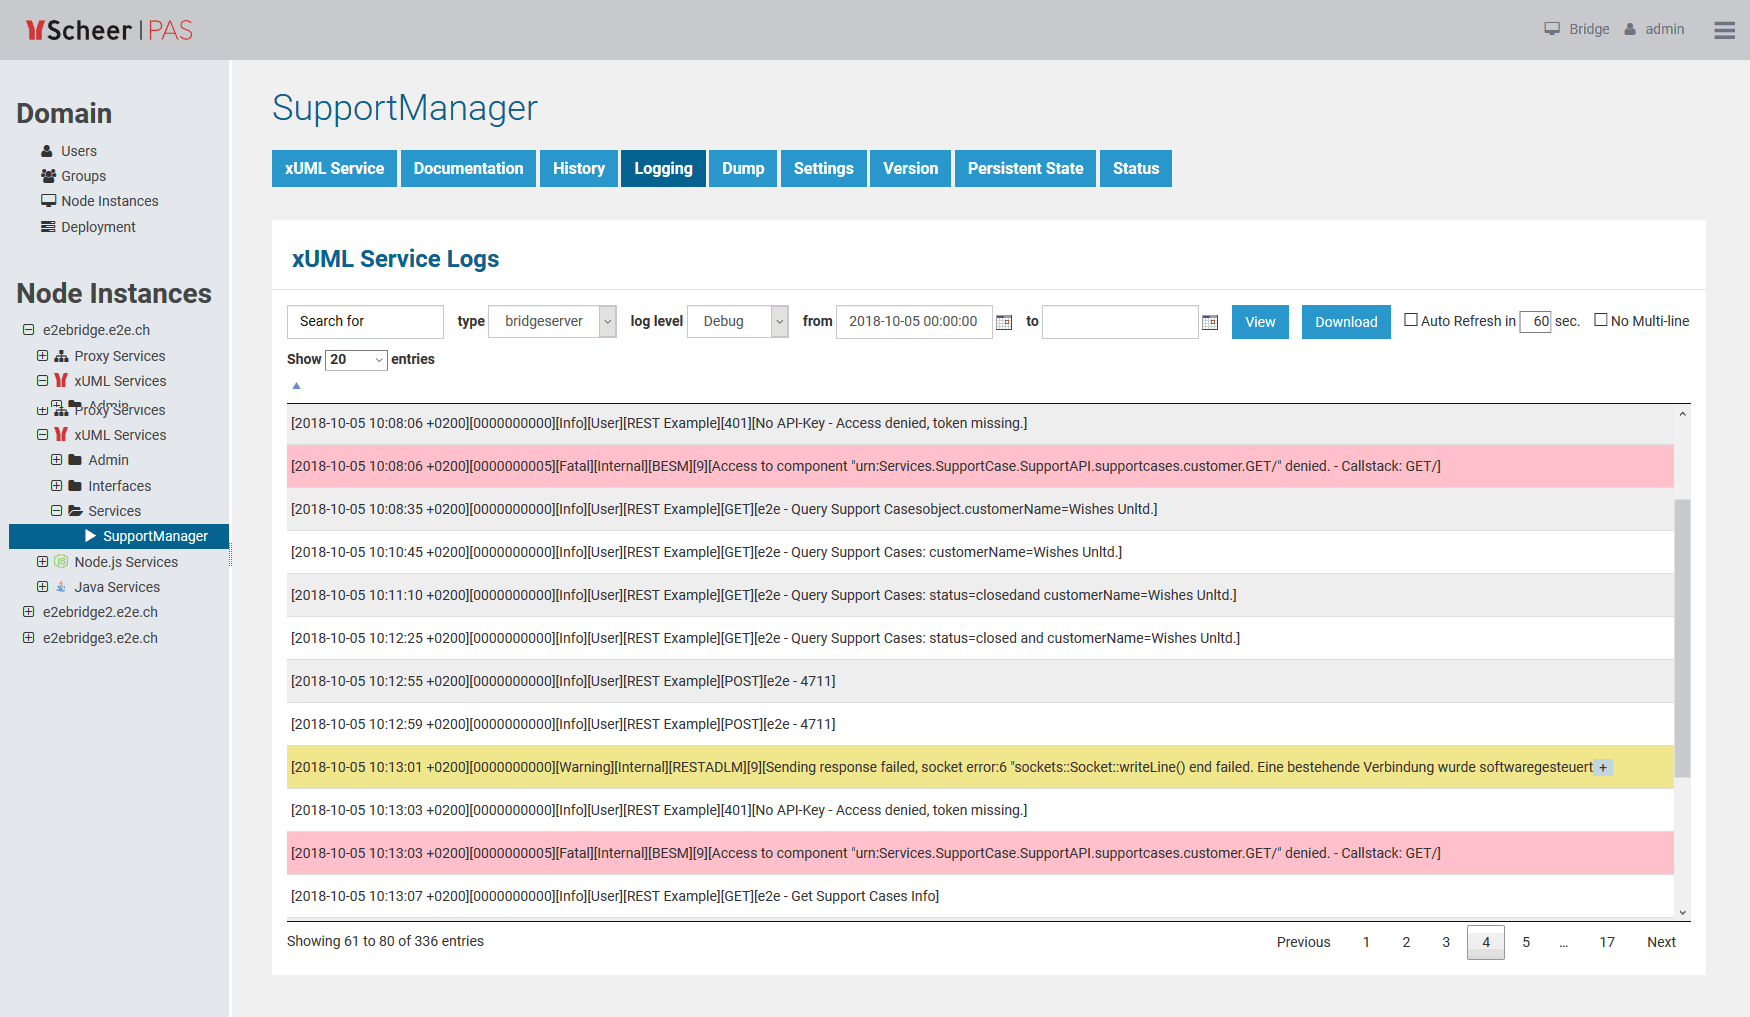
Filtering the Log Entries
Logs may contain big amounts of data and in these cases it may be difficult to find the peace of information you are looking for. Therefore, you can filter the logfile entries by log level, date/time and a regular expression.
| Filter Element | Description | Default |
|---|---|---|
| Search for | Insert a string or a valid regular expression to search the log entries for. Only log entries that match the expression will be displayed. | empty |
| in type | Select the type of logfile you want to display: bridgeserver, start, stop, transaction, custom log types. See top of this page for more information on the log types. The log types are displayed in this list in alphabetical order and the first log type of this list will be the default. So, if you added a custom log named aa.log, this log will be displayed on going to the Logging page. | first available log type |
| with log level | Select the log level of the log entries you want to inspect. Refer to Bridge Server Log Levels of an xUML Service for more information on log levels and what information they contain. This filter is only available for the xUML service standard log (bridgeserver). | Debug |
| from | Select the date/time range you want to inspect.
Pressing Enter in these fields triggers the search. To enter the dates, you can use a date picker next to the input fields: | actual timestamp - 10 min |
| to | empty |
Click View to update the displayed logging information.
As per default, for logs with a time stamp the log entries are displayed latest first in the search results. Click the tiny arrow in the table header to change the order to oldest first.
The date filter settings will be kept as long as your Browser tab is open. They will be reset to default as soon as you open the Logging tab in a new Browser tab.
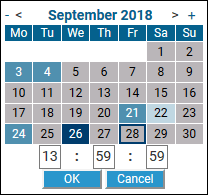
The Date Picker
When filtering the log entries of a service by date, you can use a date picker to select a date from/to. Click the date picker icon next to the input fields to open the a tiny calendar to pick the dates from.
Some dates within the calendar are colored to help you finding the appropriate date:
| Color | Meaning |
|---|---|
| dark blue border | Today. |
| dark blue | The selected date. |
| bright blue | A weekday on which data has been logged. |
| light blue | A weekend day on which data has been logged. |
| grey | A day on which no data has been logged. |
Select a day, enter a time (if necessary), and click OK to apply the selected date to the search field.
The Search Results
The results according to your search conditions are displayed in a paged list.
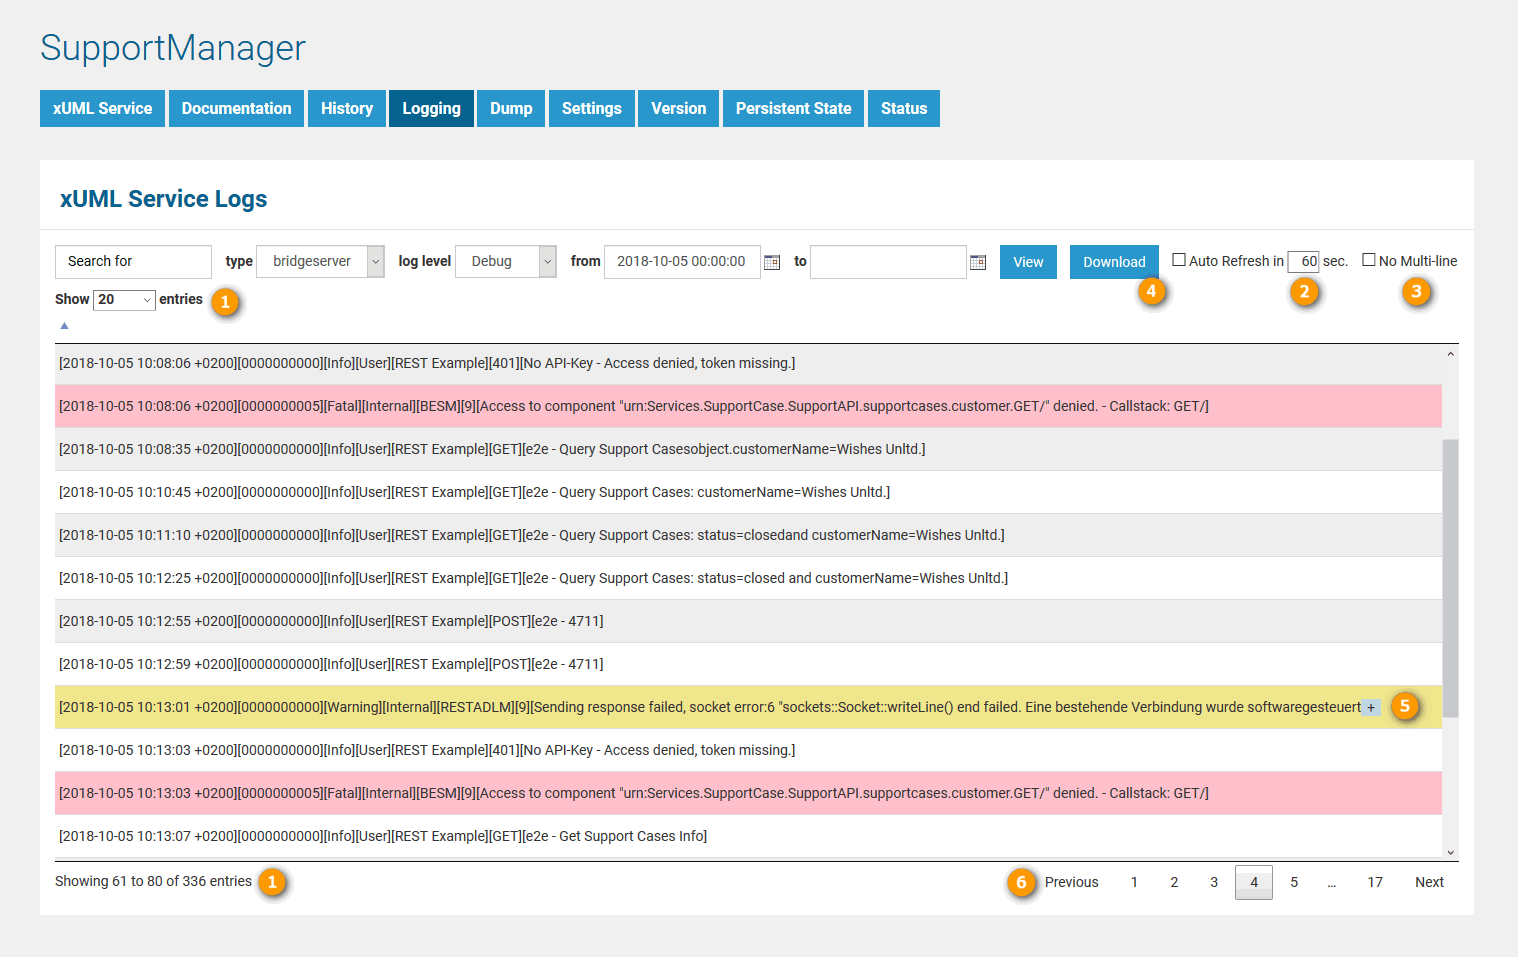
- You can define how many results should be displayed on one page by selecting on of 20, 50, 100, 250 and 1000 from the Show entries dropdown.
At the bottom of the log table, you can see how many log entries have been found and how many of them are displayed: Showing 1 to 9 of 9 entries. - Multi-line log messages are collapsed to not clutter the list of results. You can expand those multipart lines by clicking the plus sign at the end of the visible message part.
- Use the buttons Previous and Next to browse through the results, or select a result page by clicking on a page number.
The lines of search results are colored in relation to their log level:
- Error/Fatal messages are colored in red.
- Warnings are colored in yellow.
- All other messages are white or gray, alternating for a better readability.
Refining the Search
Once you have identified problems in the bridgeserver or transaction log, you can refine the search with the help of the context menu.
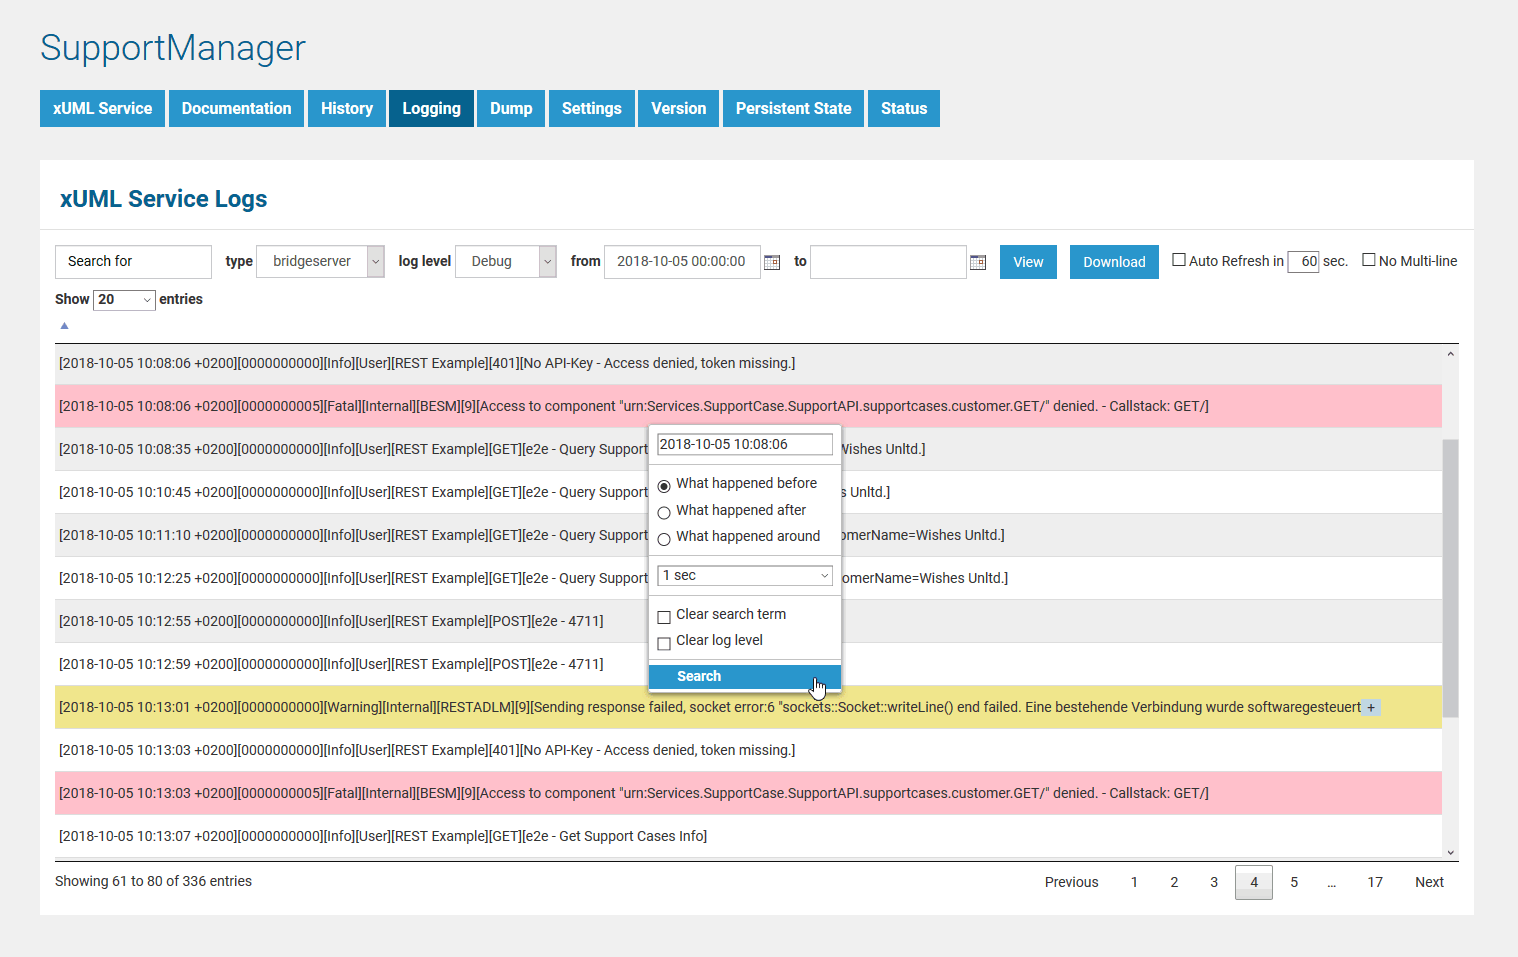
Click a log entry with the right mouse button to activate the context menu. Then, make your selections:
| Filter Element | Description | Default | |
|---|---|---|---|
| timestamp | Enter a timestamp you want to analyze in more detail. As per default, this is prepopulated with the timestamp of the selected log entry. | Timestamp of the selected log entry. | |
time focus | To analyze what happened around the selected time stamp, you can choose between:
| What happened before | |
| time frame | Set a time frame in relation to your selected focus: What happened within the specified time frame before/after/around the selected timestamp? | 1 second | |
| clear search term | Remove a specified search term from the search filter for this refinement to get more search results. | false | |
| clear log level | Remove a specified log level from the search filter for this refinement to get more search results. | false | |
Overview
Content Tools