If you are missing tracing information using the synchronous Trace Analyzer:
There are two possible reasons for not having any trace information:
- Tracing has been disabled in the test case properties.
- Tracing has been disabled on the corresponding service on the E2E Console.
Solution: Enable Tracing in the Test Case Properties
The UML tab shows the following message:
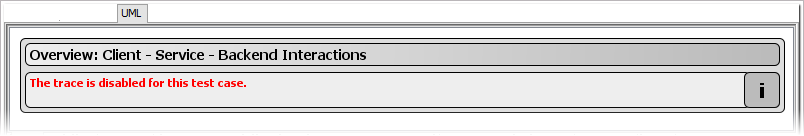
Check the test case properties and tick the checkbox Enable Trace. Check the other trace settings whether they apply to your needs.
Run the test case again.
Solution: Enable Tracing on the Corresponding Service on the E2E Bridge
The UML tab shows the following message:
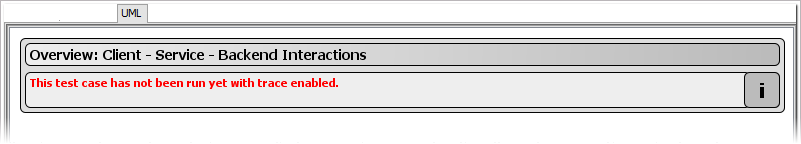
Open a browser and switch to the administration interface of the corresponding E2E Bridge. Check the xUML service preferences. Tick the checkbox Tracing Enabled and apply your changes.
Run the test case again.
If this problem arose using the asynchronous Trace Analyzer:
You clicked Show Available Traces in the content pane of the asynchronous Trace Analyzer, but no available traces were displayed.
There are three possible reasons for not having any trace information:
- Tracing has not been activated on the asynchronous test definition.
- Tracing has been disabled on the corresponding service on the E2E Bridge.
- The asynchronous trace has been triggered by a synchronous test case run, that collected the tracing information itself.
Solution: Activate Tracing on the Asynchronous Test Definition
Select the asynchronous test definition and click to read the actual tracing status of the service.
The Overview window displays the following in the asynchronous section: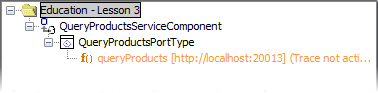
Click the button.
Repeat your tests.
Solution: Enable Tracing on the Corresponding Service on the E2E Bridge
The asynchronous Trace Analyzer shows trace as being active.
Open a browser and switch to the administration interface of the corresponding E2E Bridge. Check the xUML service preferences. Tick the checkbox Tracing Enabled .
Repeat your tests.
Solution: Disable Tracing on the Used Test Case
Check the test case properties of the used test case of the corresponding WSDL and uncheck the checkbox Enable Trace .
Run the test case again.
Overview
Content Tools