Page History
Individual process instances can be examined using You can use the instance list or instance table to examine individual process instances. As Since instance data from the from the Scheer PAS BRIDGE components (Designer, Integration and BPaaS modules ) are different in some respects, the instance displays also differ slightly.
| The instance table lists all the instances of the underlying process of an analysis. Open You can open the instance table by clicking the button via option |
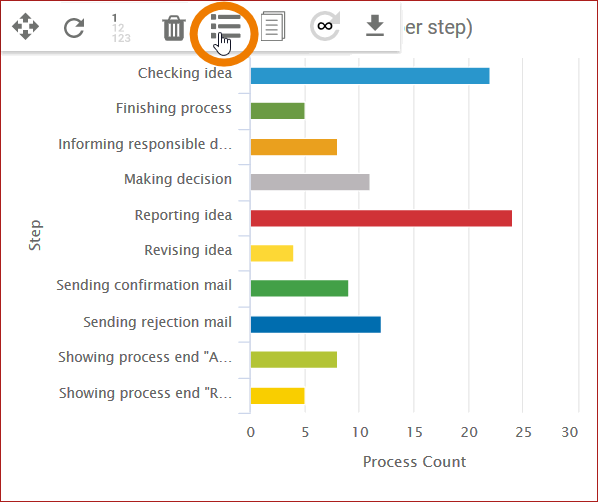
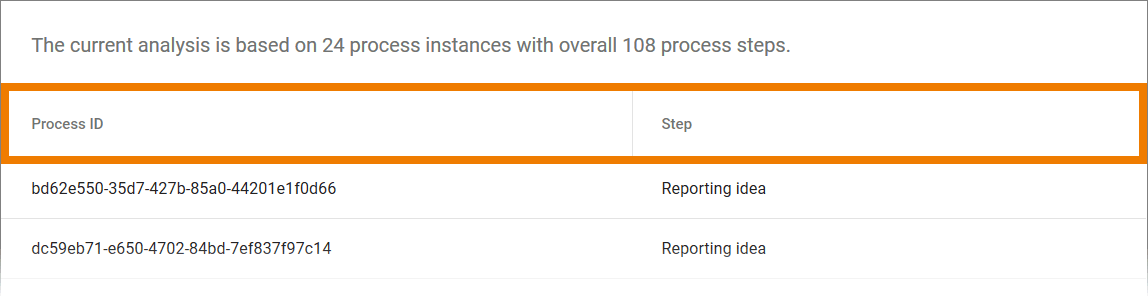
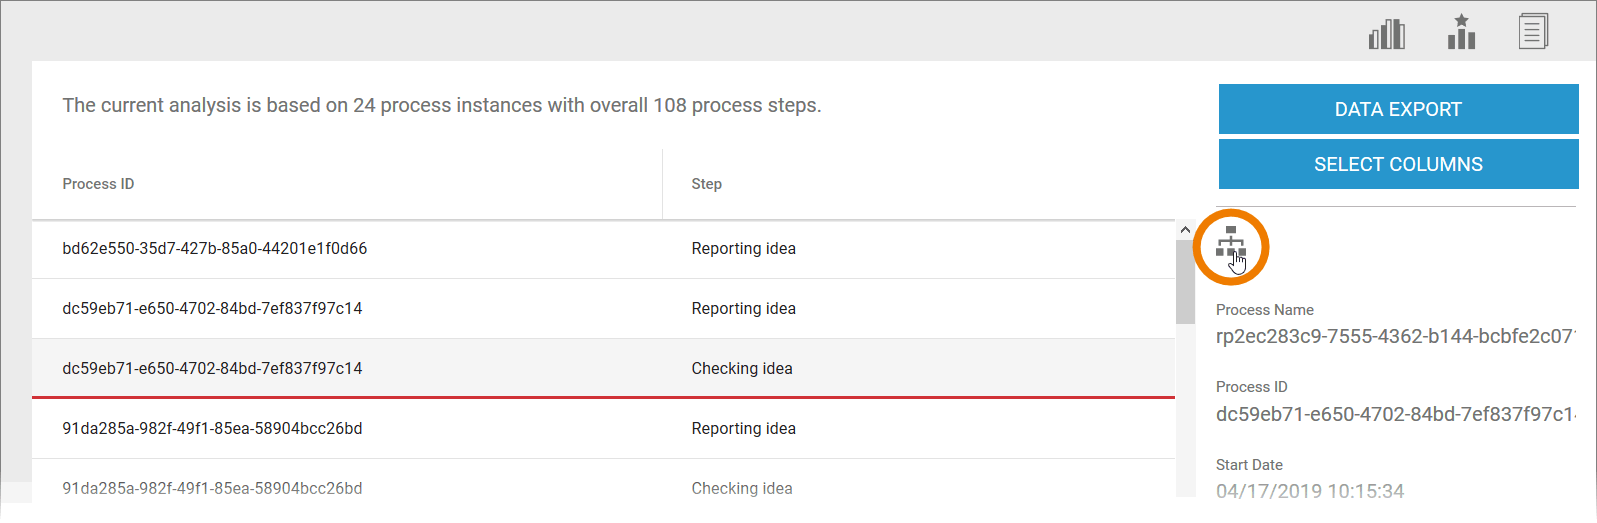
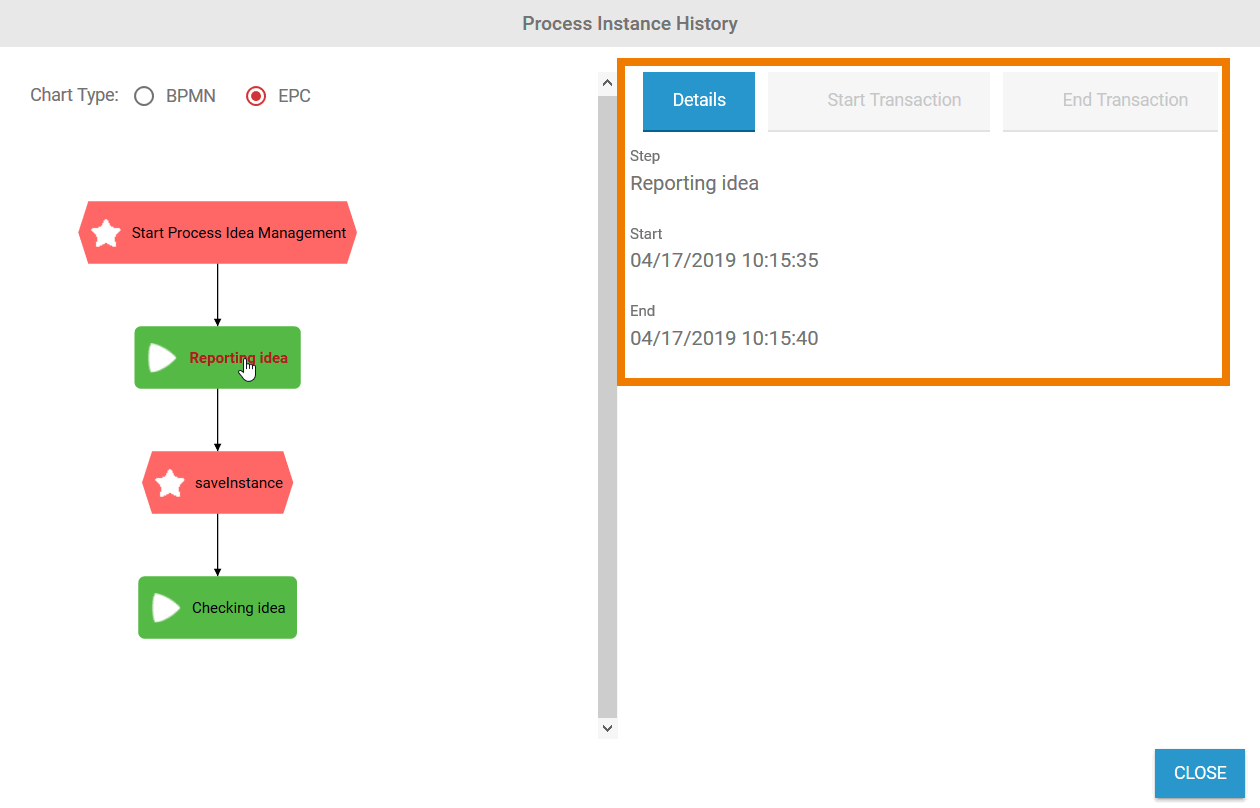
The process instances are listed on the active dialog window. The heading includes a statement of the total number:
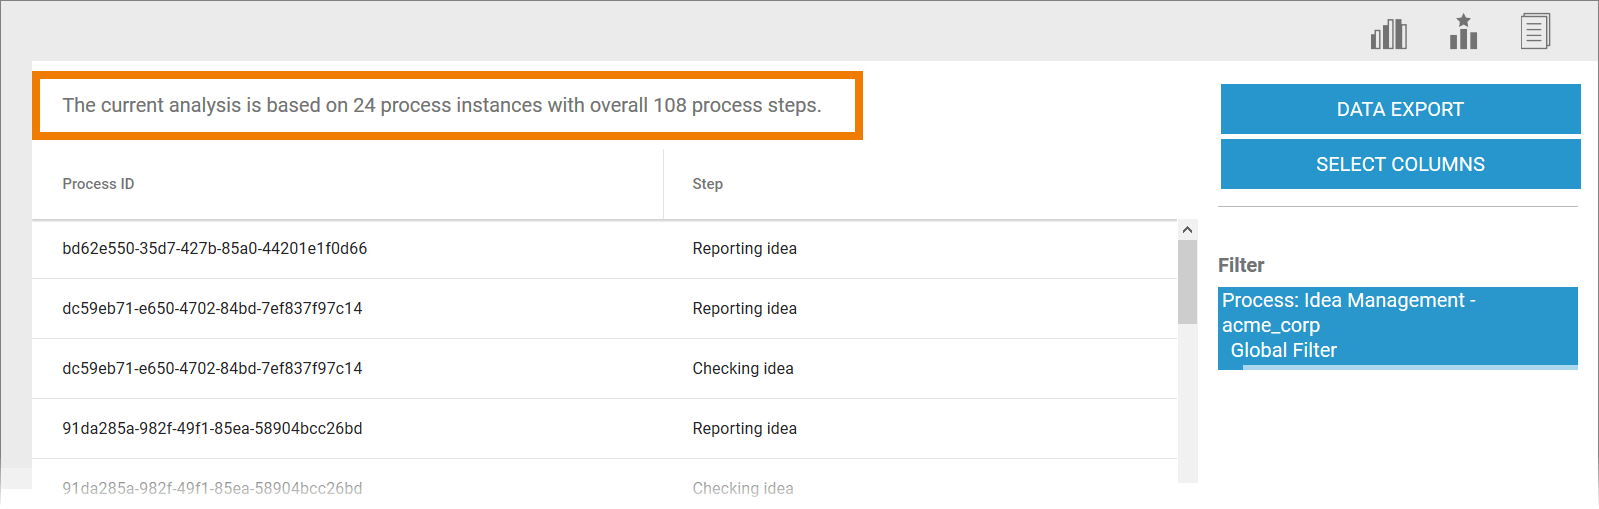
Click on an instance to select it. The instance details are shown in the sidebar:
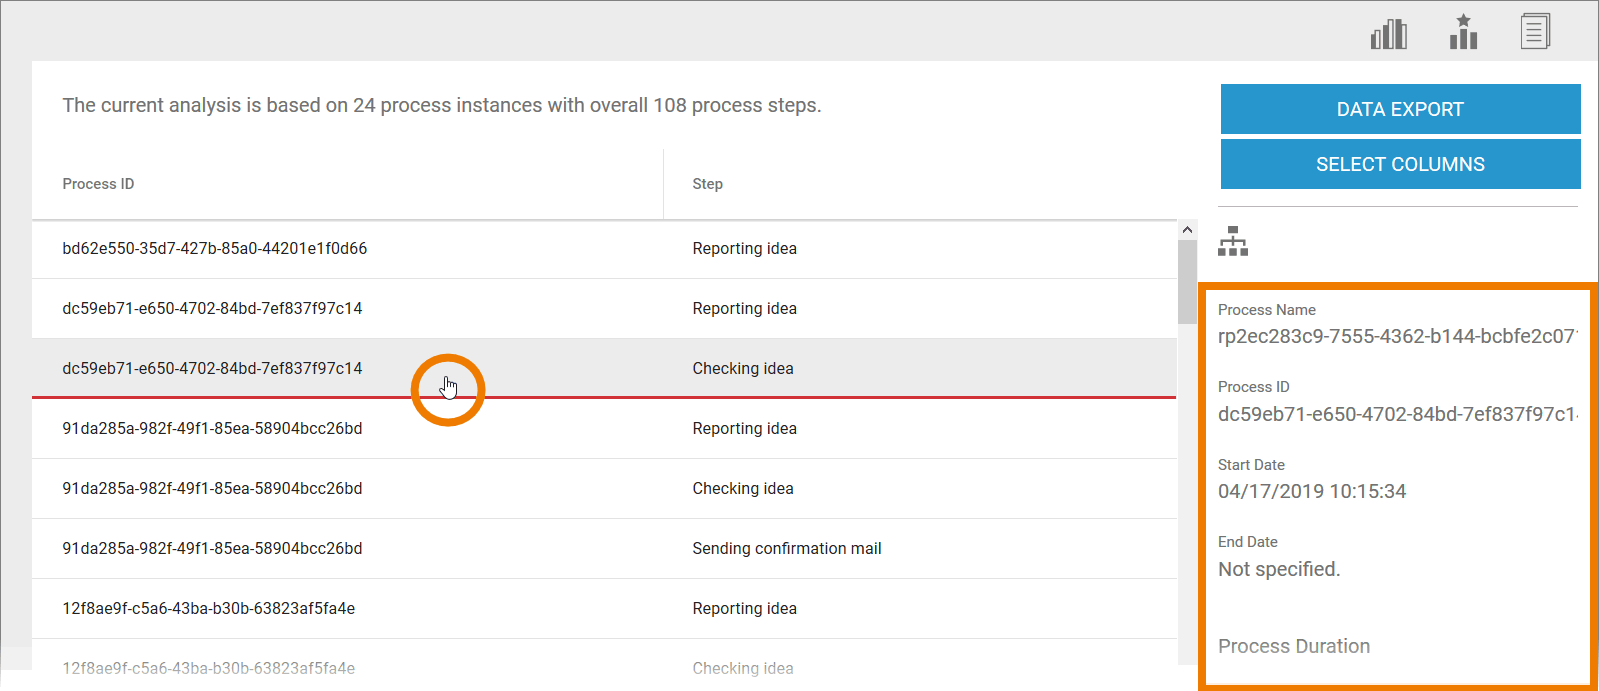
The following process instance details are shown:
- Process Name
- Process ID
- Start Date (including time, accurate to the second)
- End Date (including time, accurate to the second)
- Process Duration (accurate to the second)
Configuring the Instance List
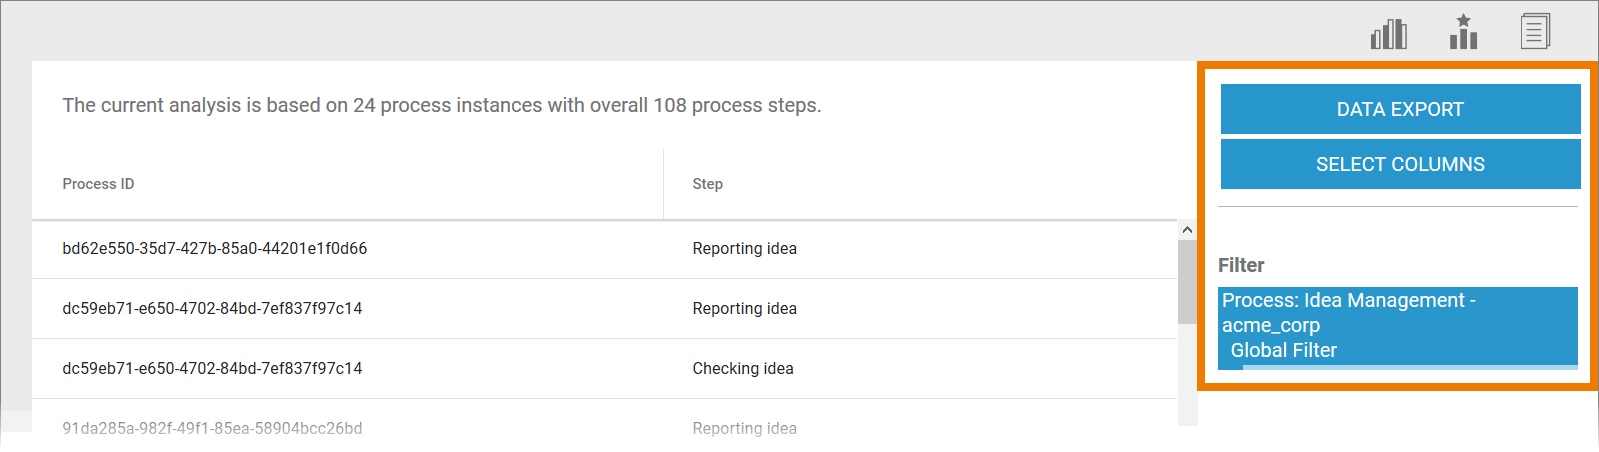
Users can configure the instance list using the buttons in the sidebar:
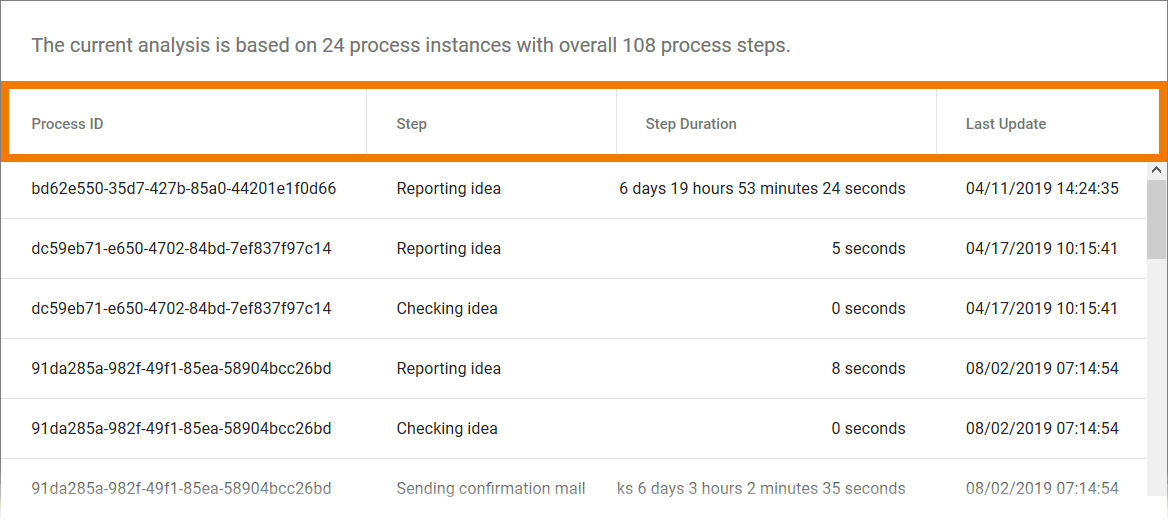
To enable identification of individual instances, the process ID is always specified as a column. The second standard column is a result of the axis allocation of the analysis:
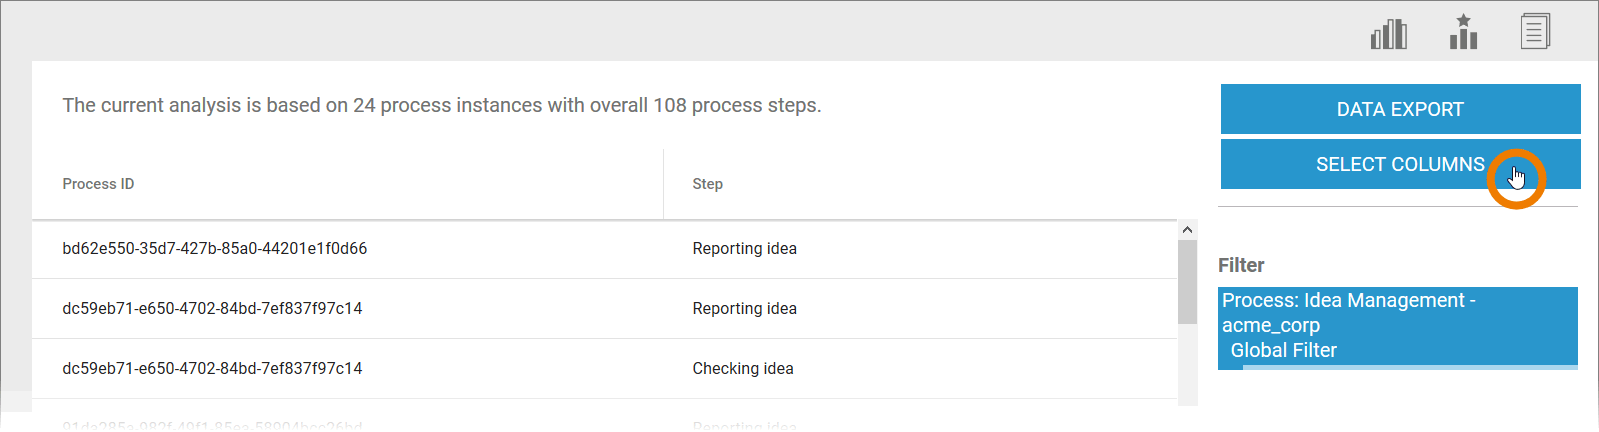
Adapting the Column Selection
The You can adapt the columns of the instance list can be adapted by the user. This is done by using the . Use option Select Columns button in in the sidebar:
| Info |
|---|
To enable identification of individual instances, the process ID is always specified as a column. Other features can be chosen freely by the user. |
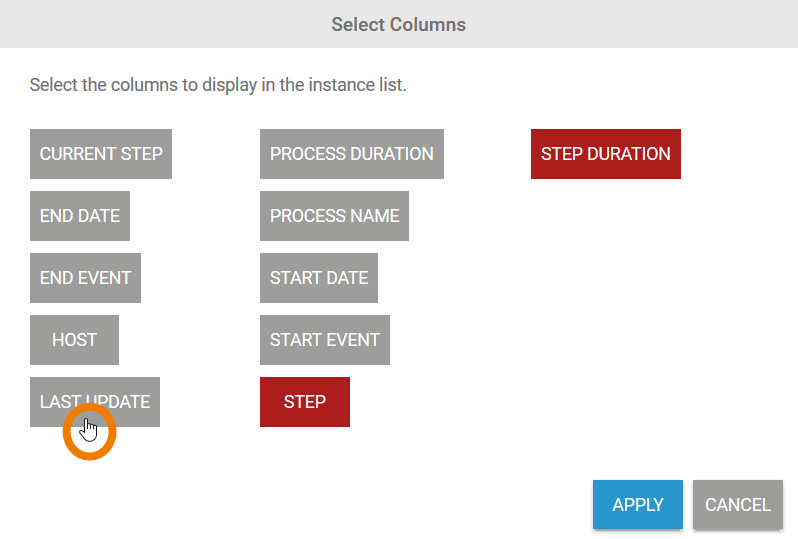
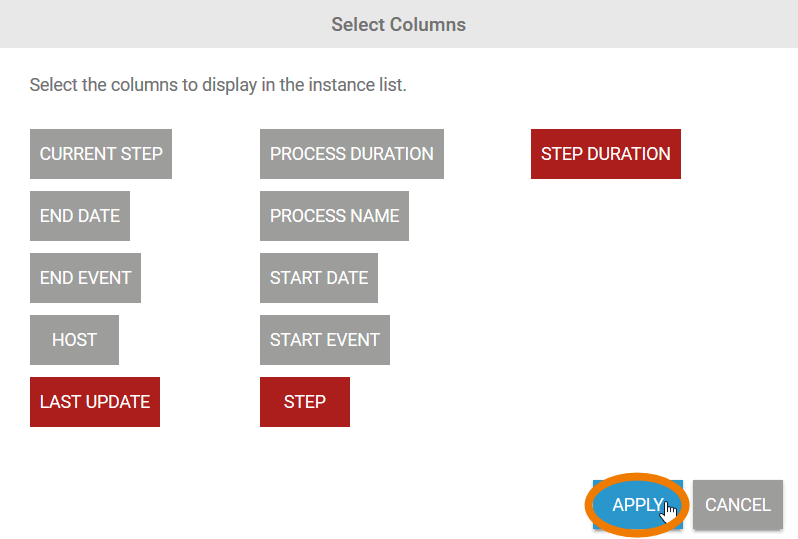
| In the Select Columns pop-up window, select dialog, select the features values that you want to create use as a column. |
| The selected column contents selected are marked highlighted in color. Click the accept button Click Apply to adopt the selection and reconfigure the instance list. |
| The selected columns selected are added to the instance list. |
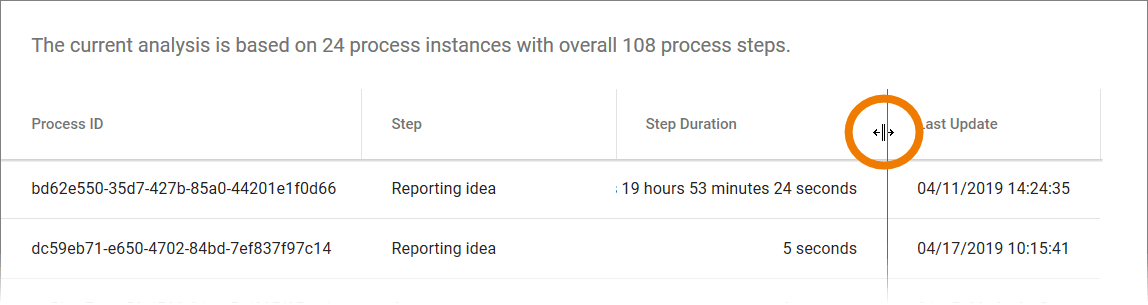
| The You can adjust the column size can be adjusted by moving the tab. |
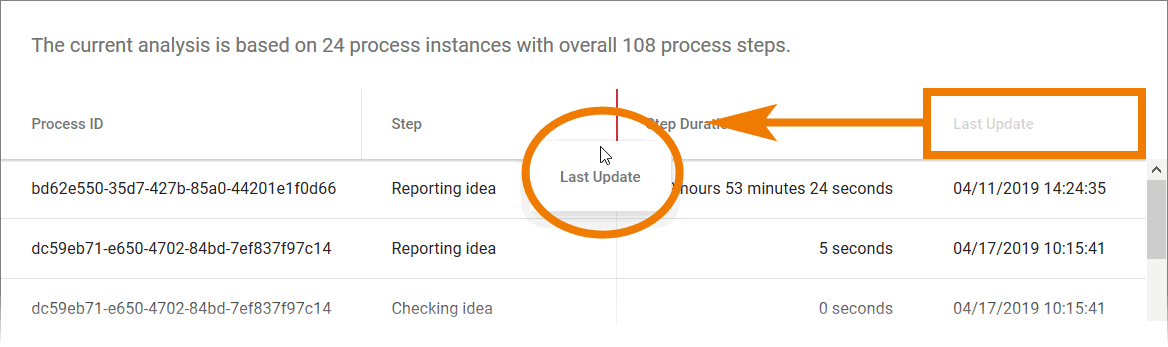
| Change You can change the column order of the display by moving an entire tab to a new position. |
Filtering the Instance List
Setting Use option Filter in the sidebar to set a filter for the instance table is possible via the sidebar:
| Note |
|---|
An instance table filter does not affect the underlying analysis. If you exit the instance table, the filter is discarded. |
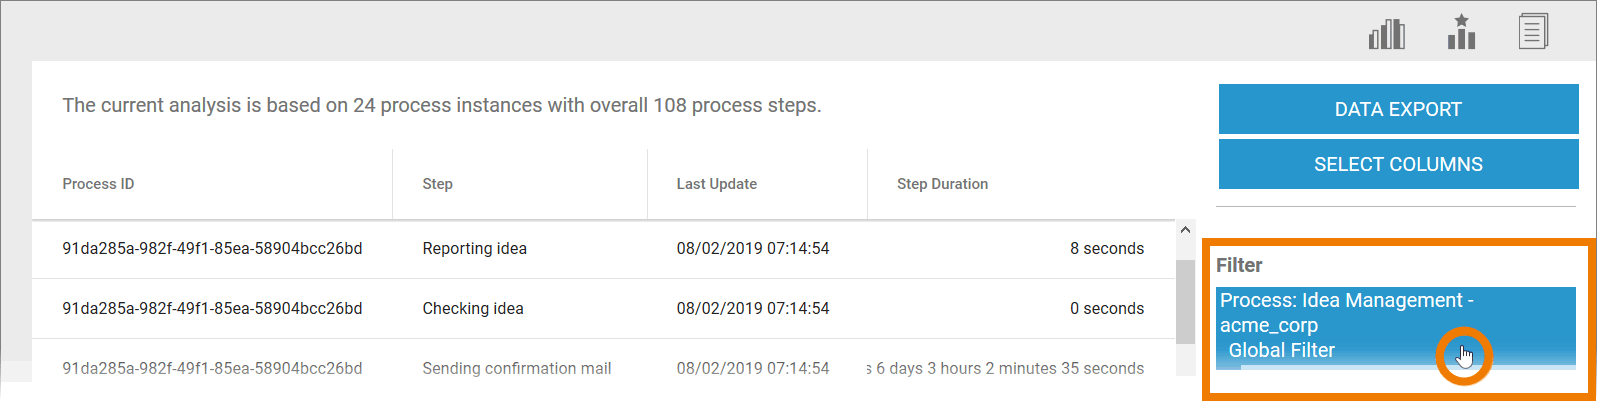
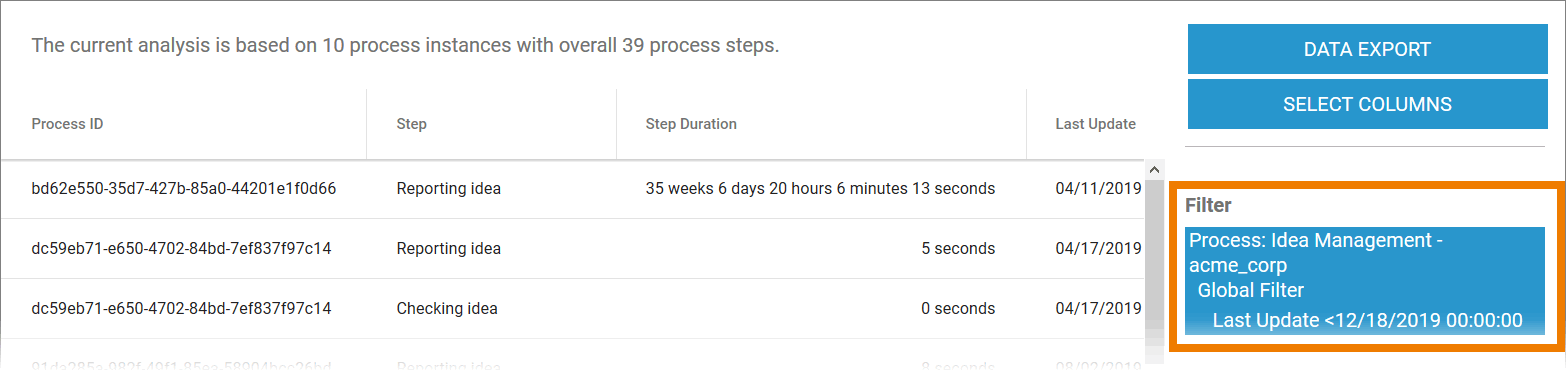
If you have already set a filter for the underlying analysis, this filter will also be applied initially to the instance table:
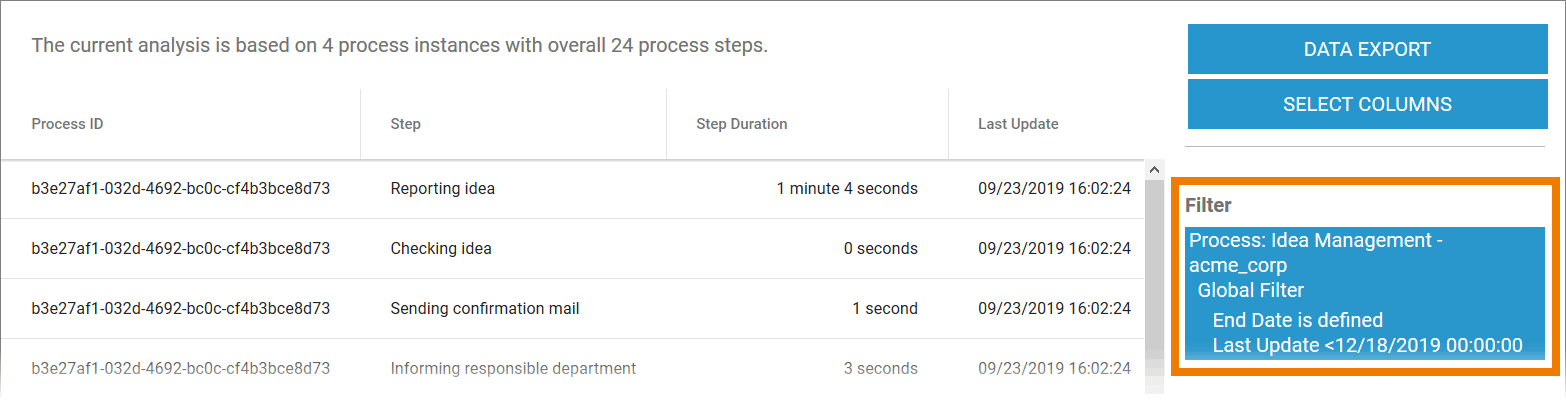
If various measure-specific filters are used in used in the analysis, these are ored stored for the instance list:
|
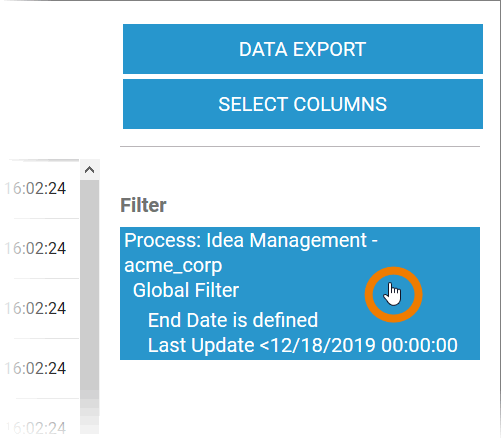
To define a new filter or to change an existing filter, click on the filter display in the sidebar. | ||
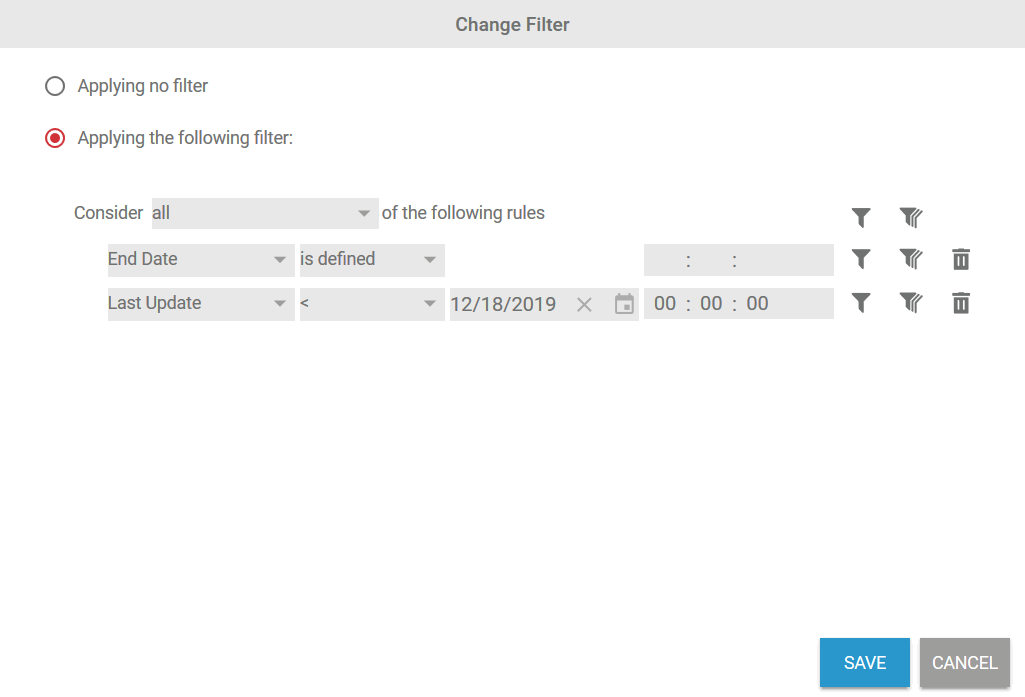
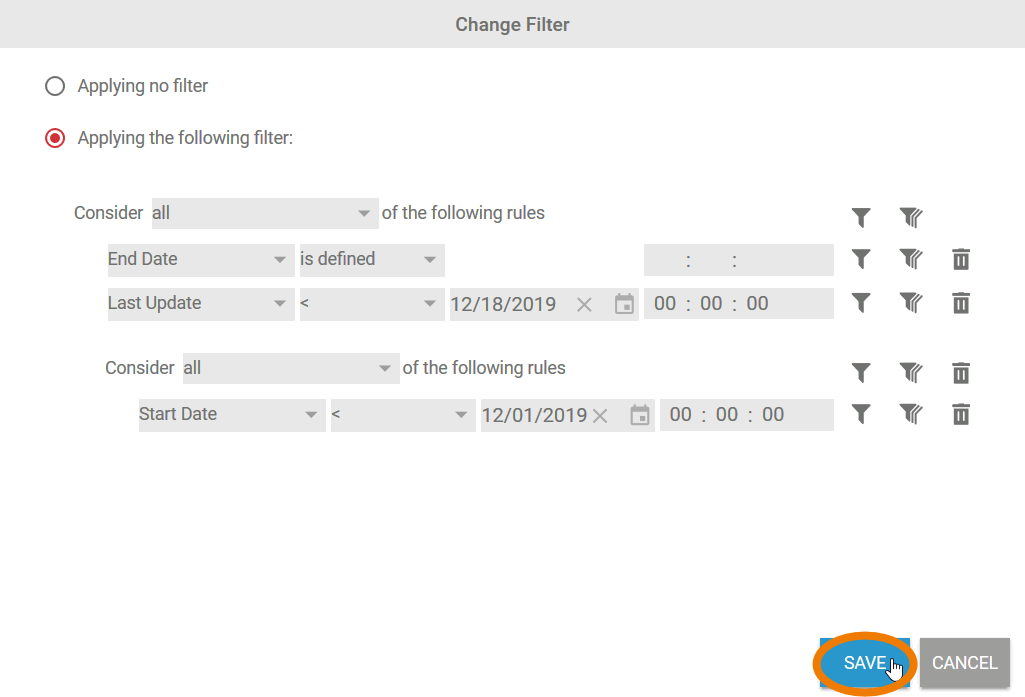
| Filter The filter settings are opened open in a separate windowdialog. To To create a new filter, select the option Applying the following filter. An instance filter is configured in accordance with the same principle as the creation of an analysis filter.
| ||
| You can create as many filters as you wish. Filters can also be nested to any depth you require. Save the entries to apply the filter to the instance list. | ||
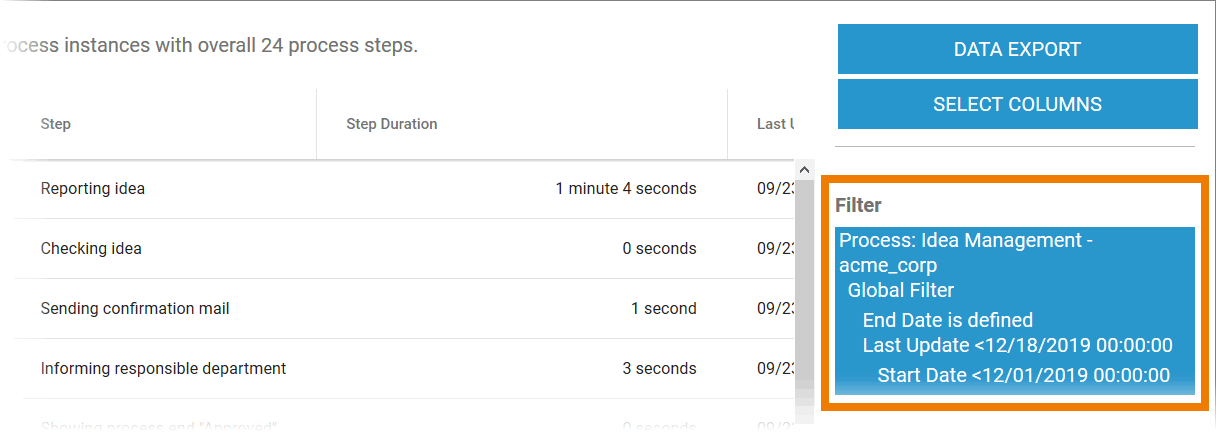
| The filter is applied to the instance list. The The filter properties settings are shown in the sidebar:. |
Sorting the Instance List
The You can also ssort the contents of the instance list can also be sorted as required. Click . Click the column you want to sort by:
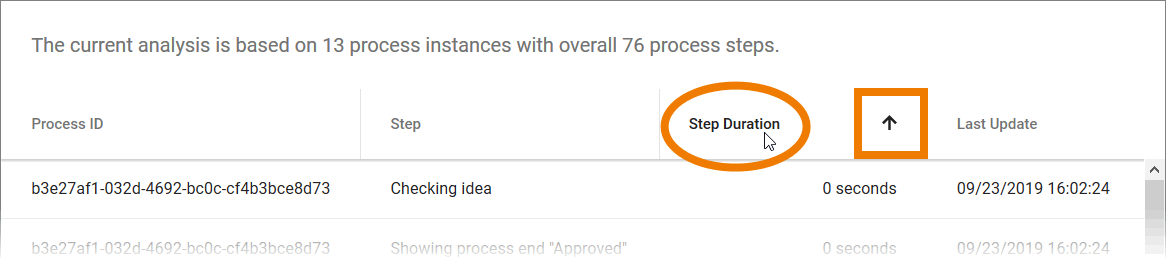
The instances are sorted according to the selected column. In addition an arrow appears in the top column, indicating whether the data has been sorted in an ascending or descending
order. The Change the direction can be changed by clicking again.
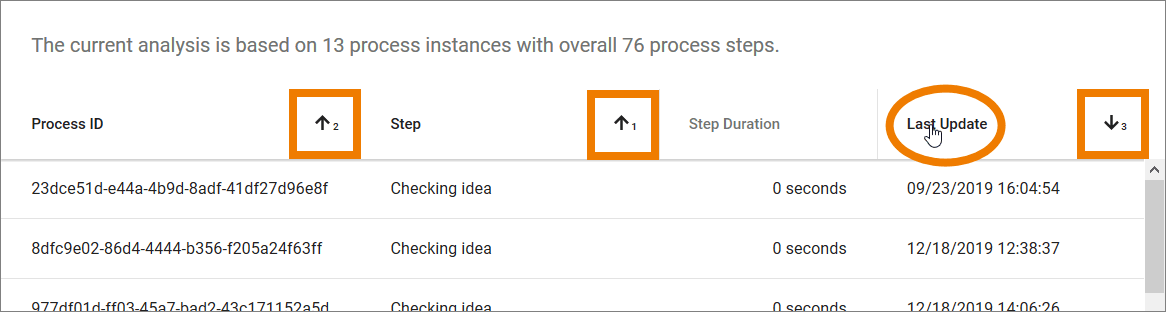
Multi-level sorting is also possible. Select the column by which you wish to sort first and then click on another column while holding down the Shift key. The sorting order is identified by the corresponding numbering of the columns:
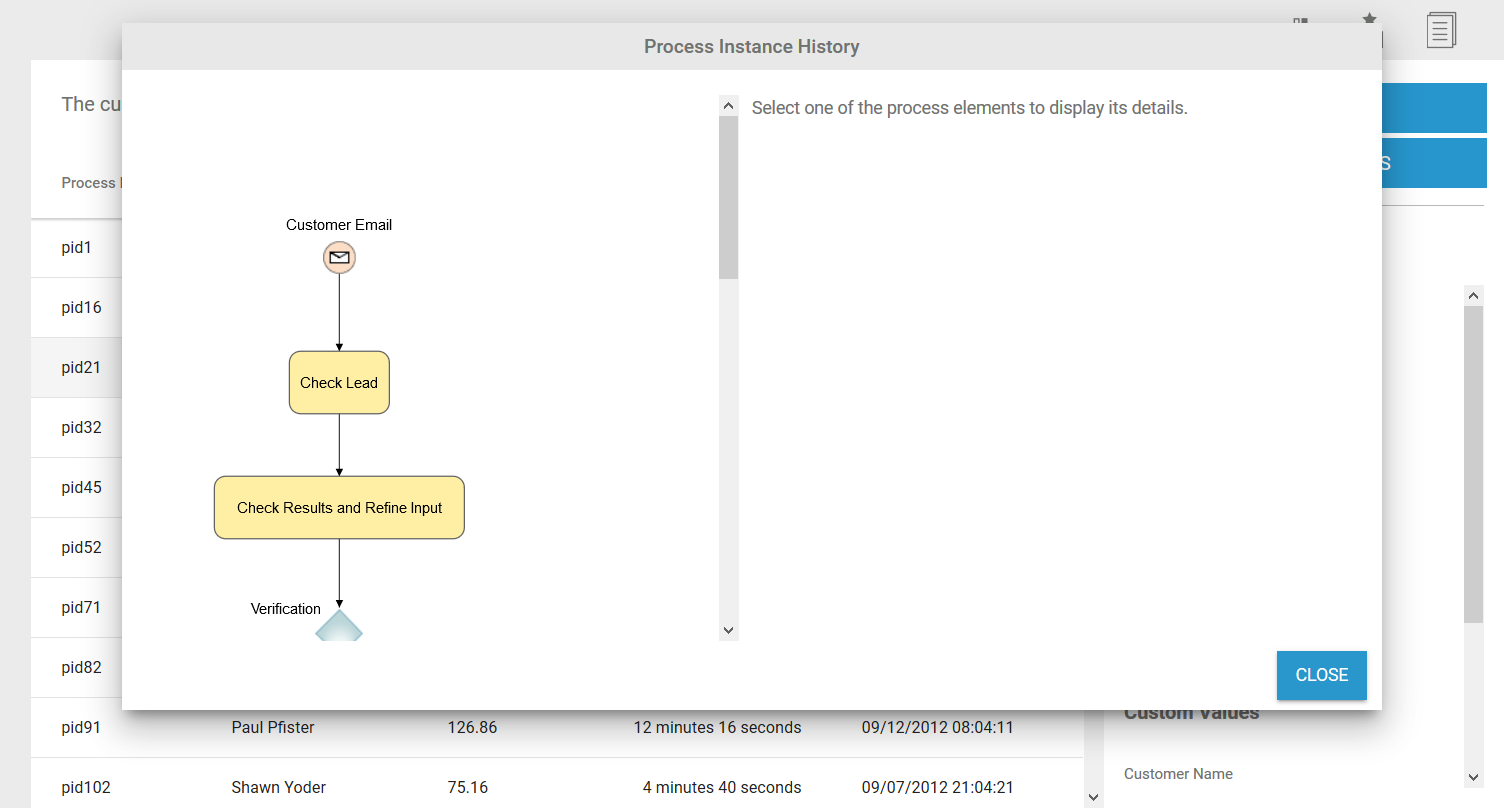
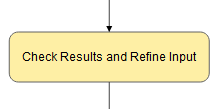
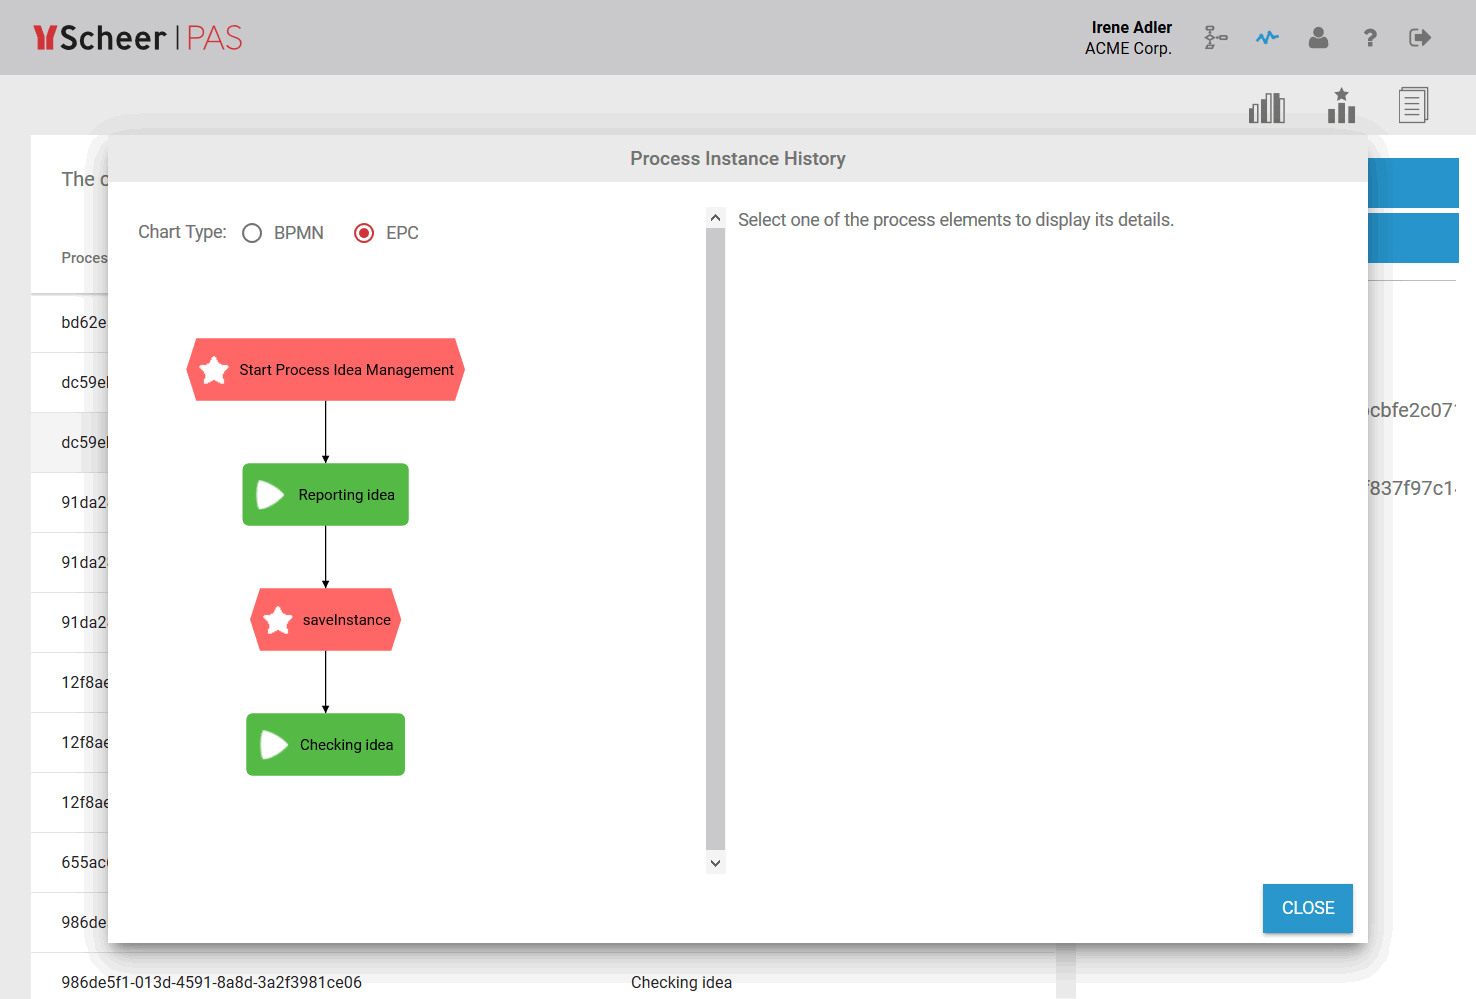
Showing Process History
The history You can display the history of the selected process instance selected can be shown using the button :. Use option
to open it.
| Expand | ||||||||||||||||||||||||||
|---|---|---|---|---|---|---|---|---|---|---|---|---|---|---|---|---|---|---|---|---|---|---|---|---|---|---|
| ||||||||||||||||||||||||||
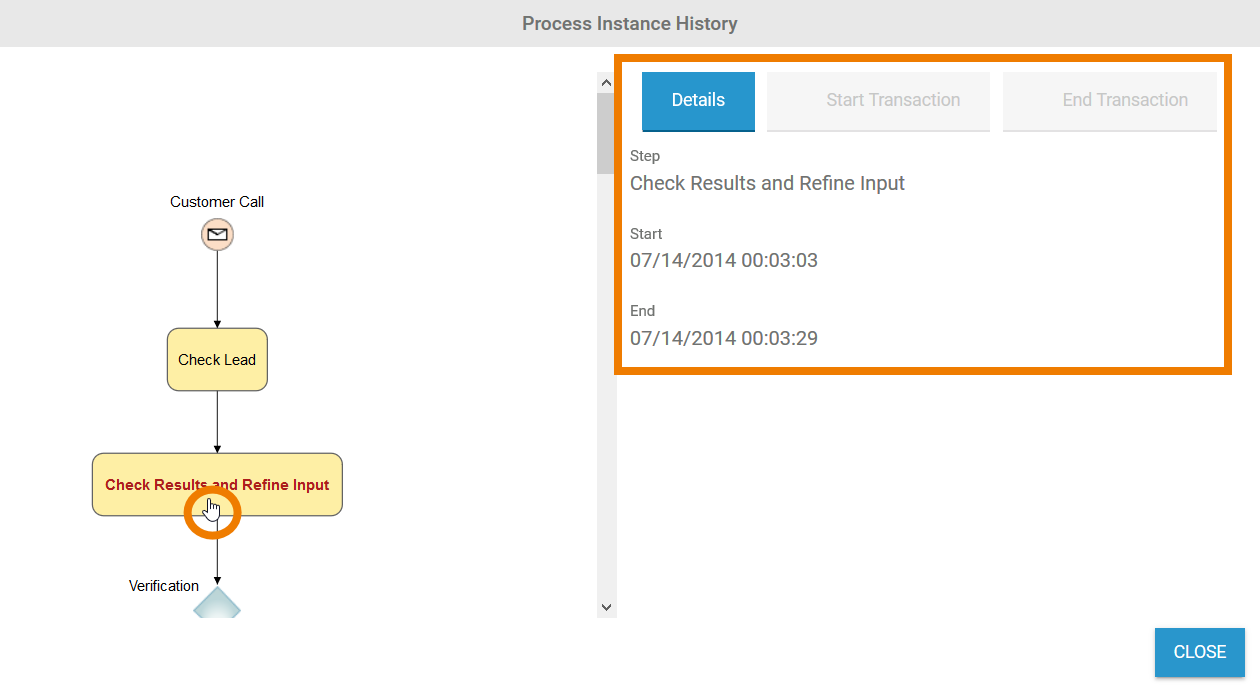
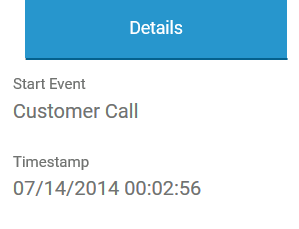
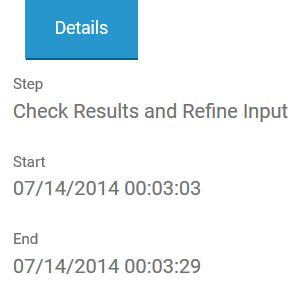
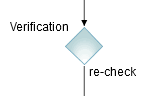
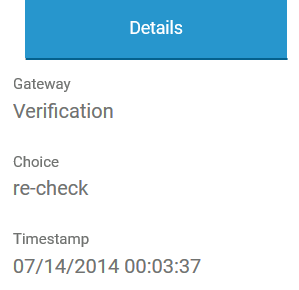
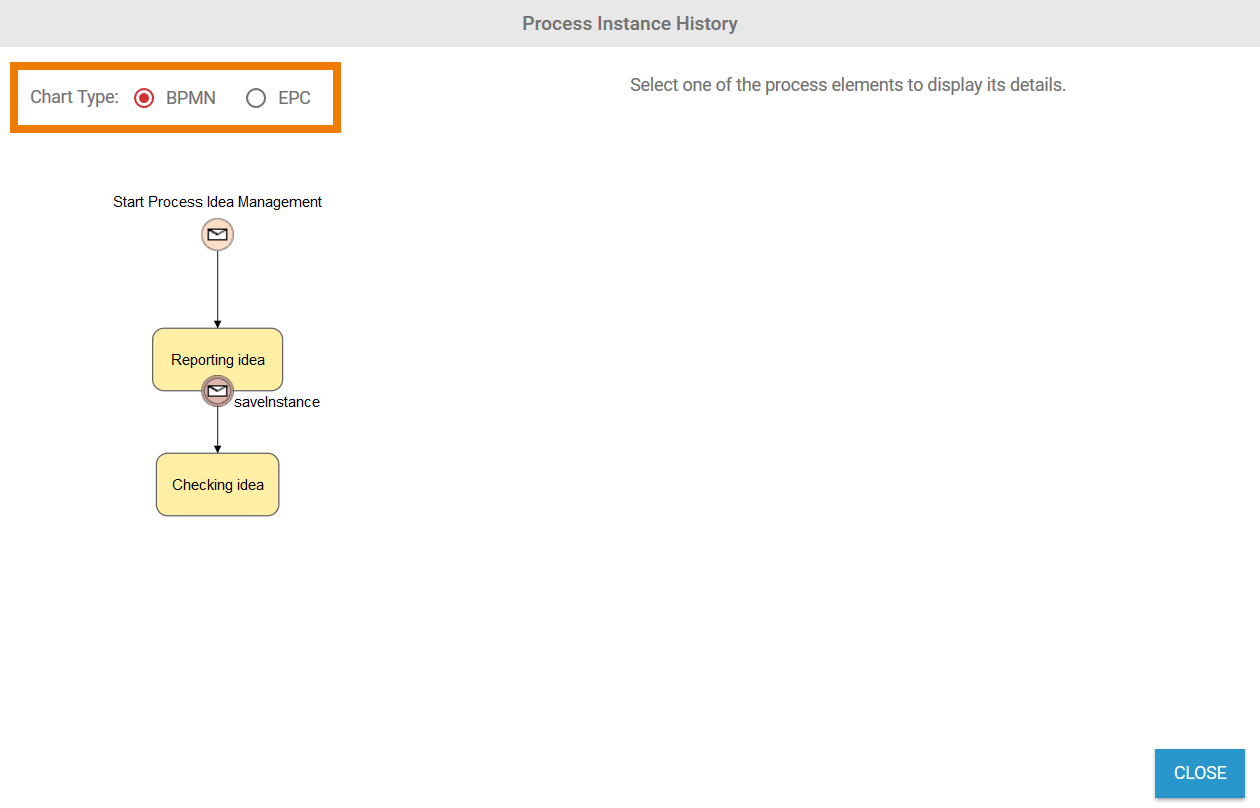
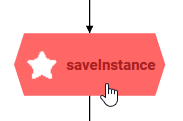
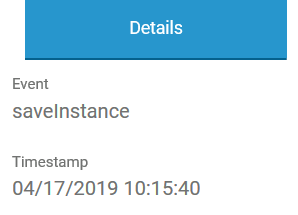
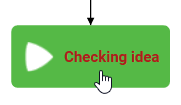
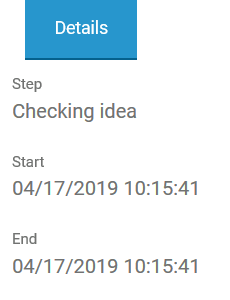
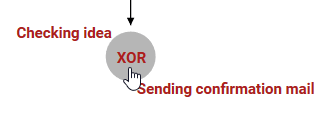
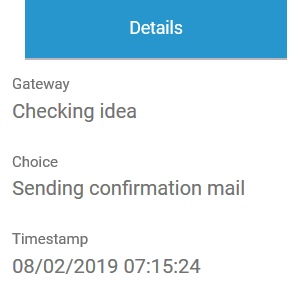
The detail view varies depending on the type of process step selected. The following details are shown:
In addition to the detail view further tabs enable , another tab allows you to display transaction data to be shown.
|
| Expand | ||||||||||||||||||||
|---|---|---|---|---|---|---|---|---|---|---|---|---|---|---|---|---|---|---|---|---|
| ||||||||||||||||||||
The detail view varies depending on the type of process step selected. The following details are shown:
|
Exporting Instance Data
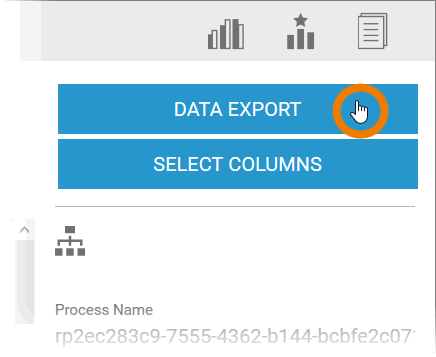
| Instance data can be exported in file format. The file formats supported are
To export instances, select the Use Data Export button in the sidebar to export instances. |
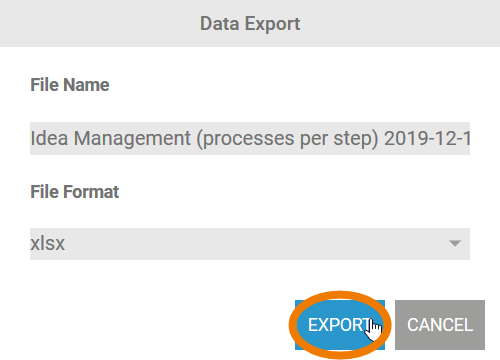
| In the Data Export window dialog, enter the desired File Name and select the File Format for for the export. The The corresponding file extension is automatically added. The process Process name and the current date are used as the standard file name. Finally, click Export to start the export using the Export buttondownload. |
Analyzing Process-specifc Values
It is also possible to transfer processpossible to transfer process-specific values to ("custom values") to Scheer PAS Process Mining. To To do this the values must be logged during execution and transferred to Process Mining.
| Expand | |||||||||||||||||||||||||||||||||||||||||||
|---|---|---|---|---|---|---|---|---|---|---|---|---|---|---|---|---|---|---|---|---|---|---|---|---|---|---|---|---|---|---|---|---|---|---|---|---|---|---|---|---|---|---|---|
| |||||||||||||||||||||||||||||||||||||||||||
Process-specific Values for Logging in Process MiningInformation on processes can be evaluated You can evaluate process information in Process Mining, for example in order to identify problems in a process. A pre-requisite for the evaluation is that the required process information required is logged and transferred to Process Mining. By default the following data is logged:
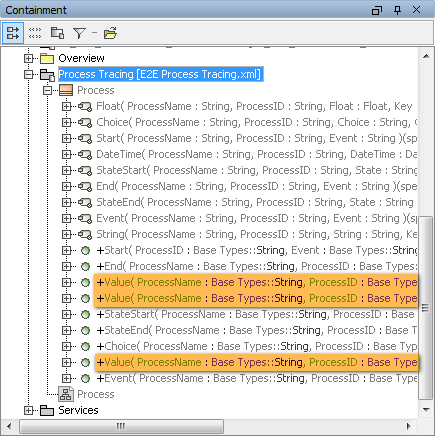
If you wish to expand the analysis with additional information on a process instance, you can widen the xUML service and log the values of customer specific fields (also referred to as custom fields or custom values). Each builder Builder model has a process tracing repository that can be used for this purpose. Illustration: Process Tracing Repository in the Containment Tree of Magic Draw
The process class contains three value operations which can be used to log additional values from String, Float and DateTime fields.
Example
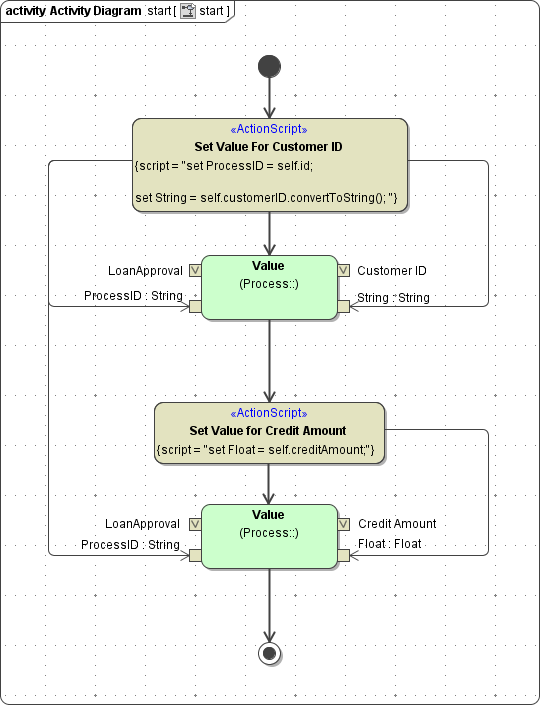
The LoanApproval example implements a very simple credit authorization process. You can find further information on this sample example process in the Scheer PAS BRIDGE Documentation > A Simple Business Process. In the Loan Approval process, additional customer specific custom fields are logged alongside the standard data:
Illustration: Logging Additional Values for Process Mining
The three value operations each contain four parameters:
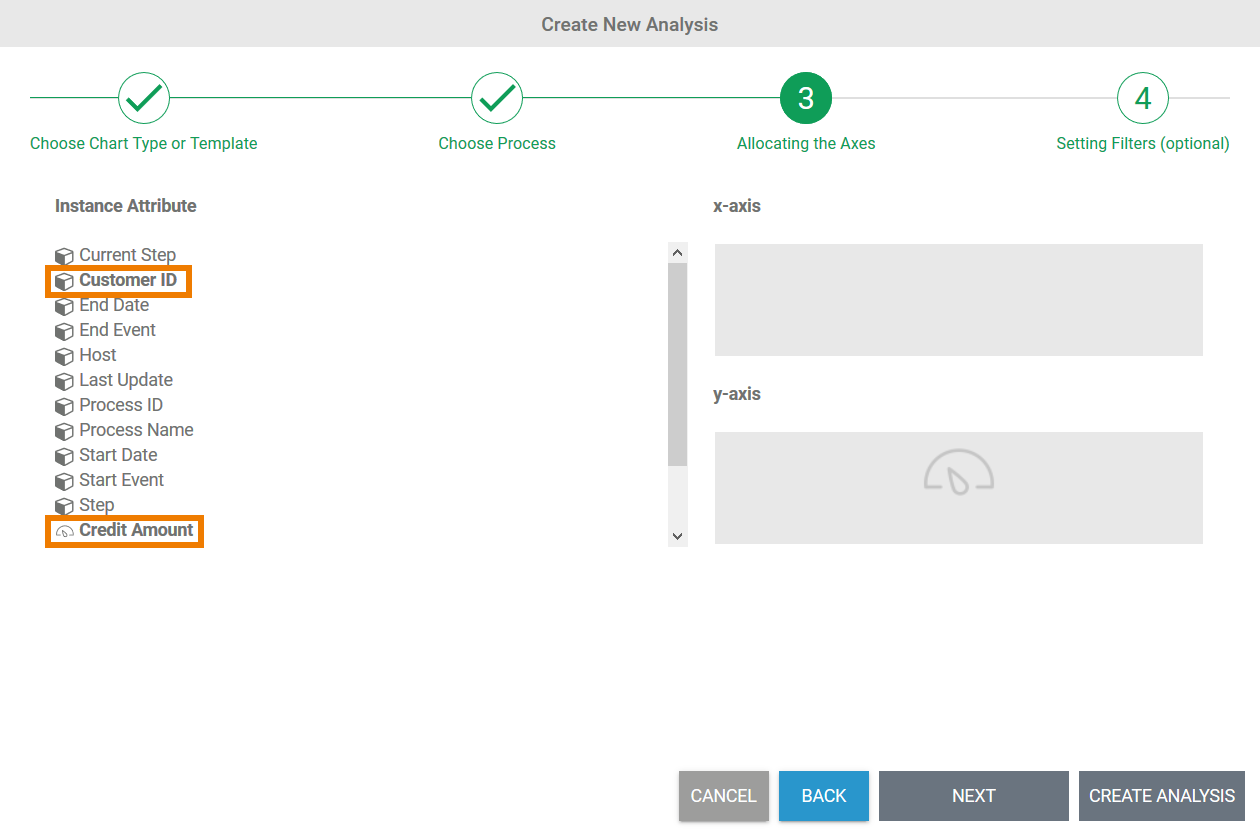
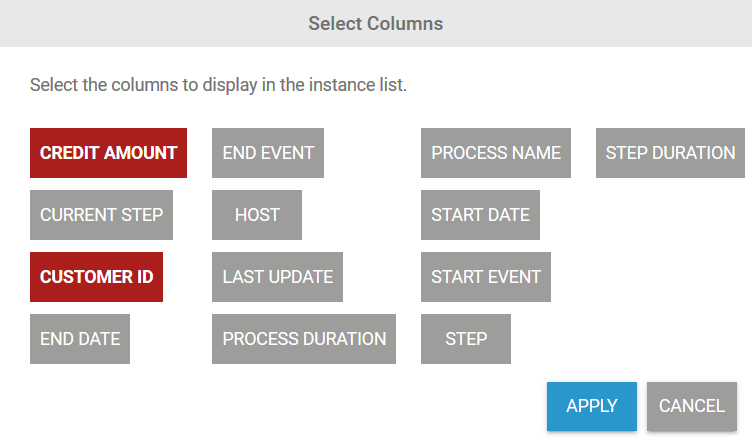
In Process Mining, custom values are displayed Customer specific fields in Process Mining are shown in bold:
|
| Expand | ||||||||
|---|---|---|---|---|---|---|---|---|
| ||||||||
Process-specific content, for example values from form fields, can be transferred to Process Mining and used in analyses. If you wish to log process specific values for Process Mining please contact your Scheer PAS consultant for advice.
|
| Expand | |||||||||||||
|---|---|---|---|---|---|---|---|---|---|---|---|---|---|
| |||||||||||||
Process-specific content, for example values from form fields, can be transferred to Process Mining and used in analyses.
Currently, log collection is only possible for services with deployment target Integration. |
| Panel | ||
|---|---|---|
| ||
|
| Panel | ||
|---|---|---|
| ||
Overview
Content Tools