Versions Compared

Key

  • This line was added.
  • This line was removed.
  • Formatting was changed.
Comment: Published by Scroll Versions from space WBRIDGE and version 24.0
Div
Classe2e-refDiv

Otp
Floatingfalse

Rp

E2E provides a standard implementation of the Monitoring Service. In general, notifications are sent by email and/or any other custom notification scheme, which can be configured using the Monitoring UI service. The standard E2E Monitoring service (E2EMailJiraMonitoring) puts JIRA as the custom notification scheme. However, alternative custom notifications schemes can be implemented as well. The bulk of the required functionality is implemented in a xUML library libMonitoring. The BPMN diagram below illustrates the overall process (click to enlarge):

Image Modified

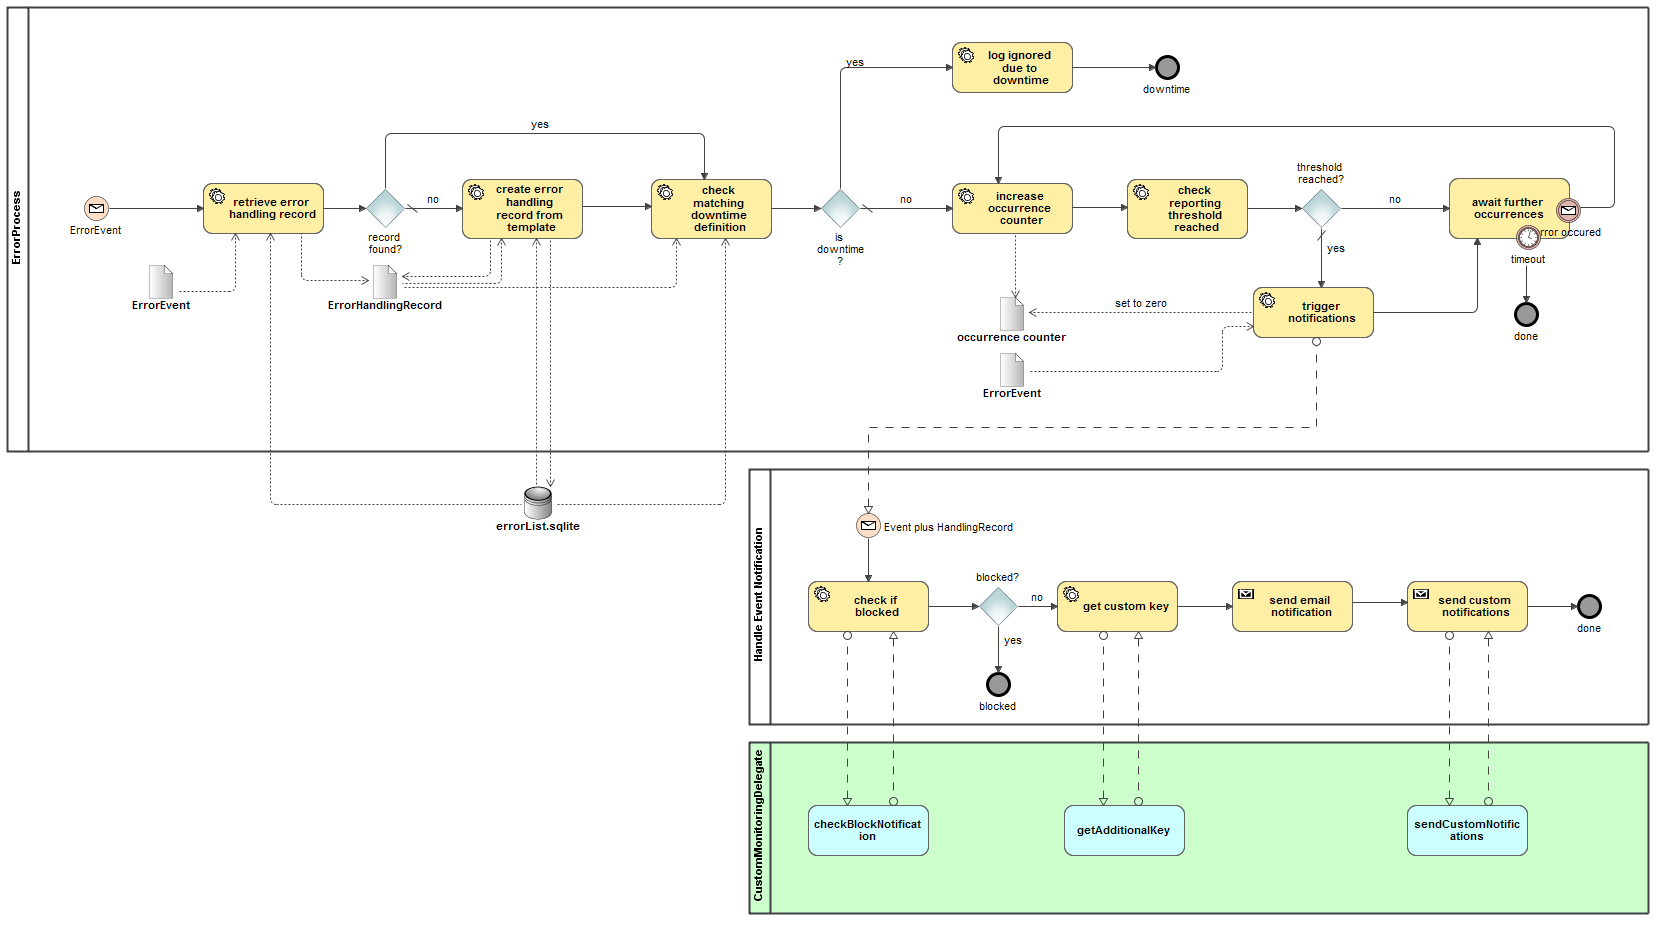
When the E2E Bridge sends an error to be notified, the notification port first performs a couple of checks (i.e. whether a dedicated handling record exists, whether a downtime has been configured, whether the occurrence counter reached the threshold for reporting). In case these checks all go fine, the notification sub process is started. This sub process defines three extension points for custom notifications:

  • checkBlockNotification: return true to suppress the notification of this error
  • getAdditionalKey: provide a string value, which will be included in the email notification as additional key
  • sendCustomNotifications: perform any custom notification you want

The mechanism by which these extension points are called is by means of a CustomMonitoringDelegate class which you have to provide in your custom monitoring service.

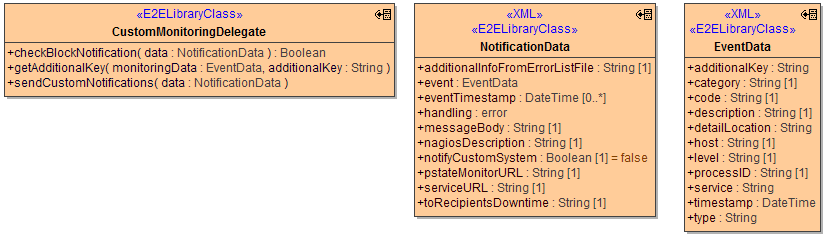
Implementing the CustomMonitoringDelegate

The CustomMonitoringDelegate shall implement three methods, which get the notification in question as parameter. See the below class diagram for an overview:

Image Modified

...


OperationParameterTypeDirectionDescriptionValues/Example
checkBlockNotificationdataNotificationDatainContains the notification data.

...


blockBooleanoutUse this flag to block the notification from being sent (default = false).falseDo not block notifications (default).
trueBlock notifications.
getAdditionalKeymonitoringDataEventDatainContains the event data.

...


additionalKeyStringoutUsed to return a string that will be added in the monitoring email as an additional key (default = none)a valid string
sendCustomNotificationsdataNotificationDatainContains the notification data for your custom notification handling.

...


In most cases, the content of the EventData (which can be accessed through the NotificationData instance) instance shall suffice. On some rare occasions, additional information which is internally held in the NotificationData structure might be useful as well, so we decided to provide it as parameter, even if most of its attributes will be irrelevant for the task at hand.

ClassAttribute NameTypeDescription
EventDataserviceStringName of the service that originally has thrown the error.
typeStringError type.
codeStringError code.
additionalKeyStringAdditional key for persistent state error objects.
levelStringError log level.
categoryStringError category.
hostStringHost name where the error occurred.
timestampDateTimeTimestamp when the error occurred.
processIDStringID of the process in which the error occurred.
detailLocationStringLocation of the logfile the error originally was logged to.
descriptionStringError description.
NotificationDatanagiosDescriptionStringDescription for the Nagios command (only used with Nagios).
additionalInfoFromErrorListFileStringAdditional values for this specific error (threshold, remarks).
This content is coming from the configurations specified in the Monitoring UI for this kind of error (see Usage of the Monitoring UI).
eventEventDataSpecifies the EventData object to be notified.
eventTimestampArray of DateTimeTimestamp when the error occurred.
handlingerrorThe error object that lead to this event.
messageBodyStringThe body of the email message that will be sent.
nagiosDescriptionStringThe description for the Nagios command (only used with Nagios).
notifyCustomSystemBooleanThe configuration setting, telling if custom notification is requested for this error.
pstateMonitorURLStringURL of the corresponding persistent state object.
serviceURLStringURL of the service that originally threw the error.
toRecipientsDowntimeStringList of recipients configured to be notified in case of downtime.

Setting up Your Custom Monitoring Service

In order to setup your custom monitoring service, you have to perform the following steps:

  1. Create a new E2E model.
  2. Import libMonitoring.lrep (provided by E2E).
  3. Create your delegate, inheriting from the CustomMonitoringDelegate class provided in the library.
    • e.g. MyMonitoringDelegate, Base Classifier libMonitoring::MonitoringService::Delegates::CustomMonitoringDelegate
    • Override the three methods mentioned above to suit your needs.
  4. Create your delegate factory, implementing the CustomMonitoringDelegateFactory interface provided in the library.
    • e.g. MyMonitoringDelegateFactory, Realized Interface libMonitoring::MonitoringService::Delegates::CustomMonitoringDelegateFactory
    • Implement the createDelegate method, in which you create an instance of MyMonitoringDelegate and return it as output.
  5. Create a service start up activity.
    • Create an activity, e.g. onServiceStartup.
    • In this activity
      1. Create an instance settings of libMonitoring::MonitoringService::CustomMonitoringSettings.
      2. Create an instance factory of your MyMonitoringDelegateFactory.
      3. Use the memory adapter to globally store the factory under key settings.delegateFactoryKey.
  6. Create a component diagram for your service, and at least
    • Create E2ESOAPService MonitoringService on port 19000, and assign the library E2ESOAPPortType MonitoringPort to it.
    • Create E2ESOAPService MonitoringServiceUI on port 19002, and assign the library E2ESOAPPortType MonitoringUIDBHandling to it.
    • Create E2ESOAPService MonitoringInfoService on port 19003, and assign the library E2ESOAPPortType InfoPort to it.
    • Select Aliases/Resources libMonitoring and MailLibrary.
    • On the E2EComposite, select your startup activity in the attribute startupActicity.
    • Create any additional services you may have created ports for.
    • Select any additional resources you may have defined/imported.

The service name and port number scheme used in the component diagram ensures backwards compatibility with previous versions of Monitoring services. You are free to assign different names and ports, but this will require you to adjust the SOAP client settings on the Monitoring UI as well as the Monitoring SOAP port settings on the E2E Bridge.

Panel
titleOn this Page:
Table of Contents
Panel
titleRelated Pages: