Page History
New charts are created via the Analyses Sidebar. To do this, unhide the sidebar and drag the New Analysis link to the Process Analyzer user interface:
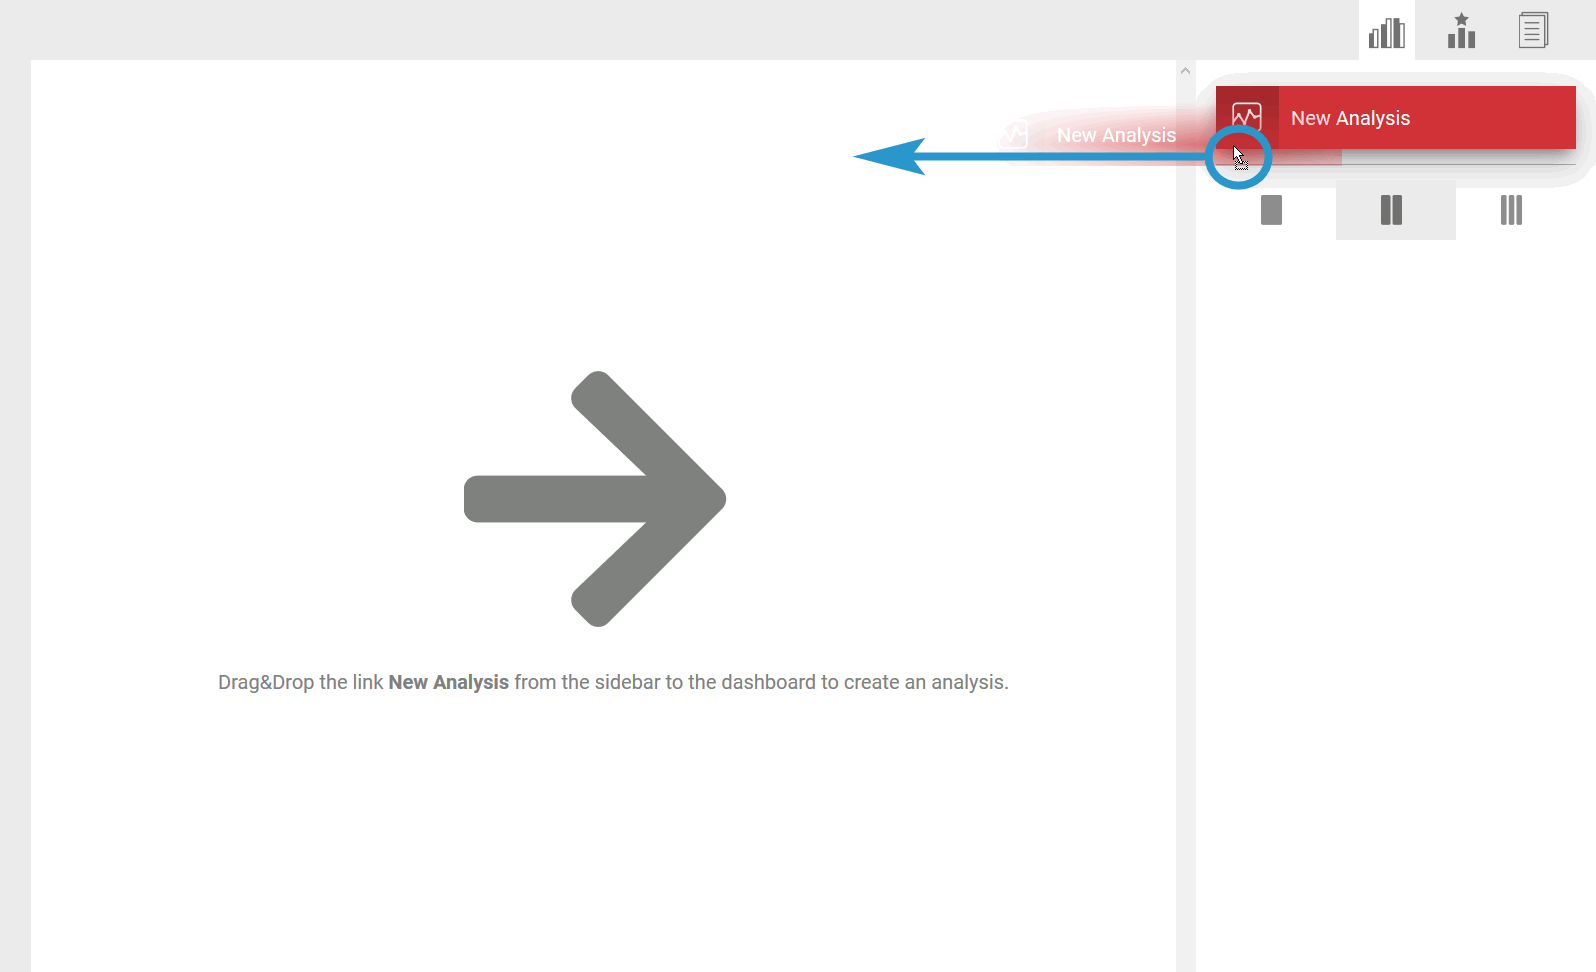
The creation of new analyses is supported by a wizard. The options available for creating an analysis are described in detail on the Creating an Analysis page.
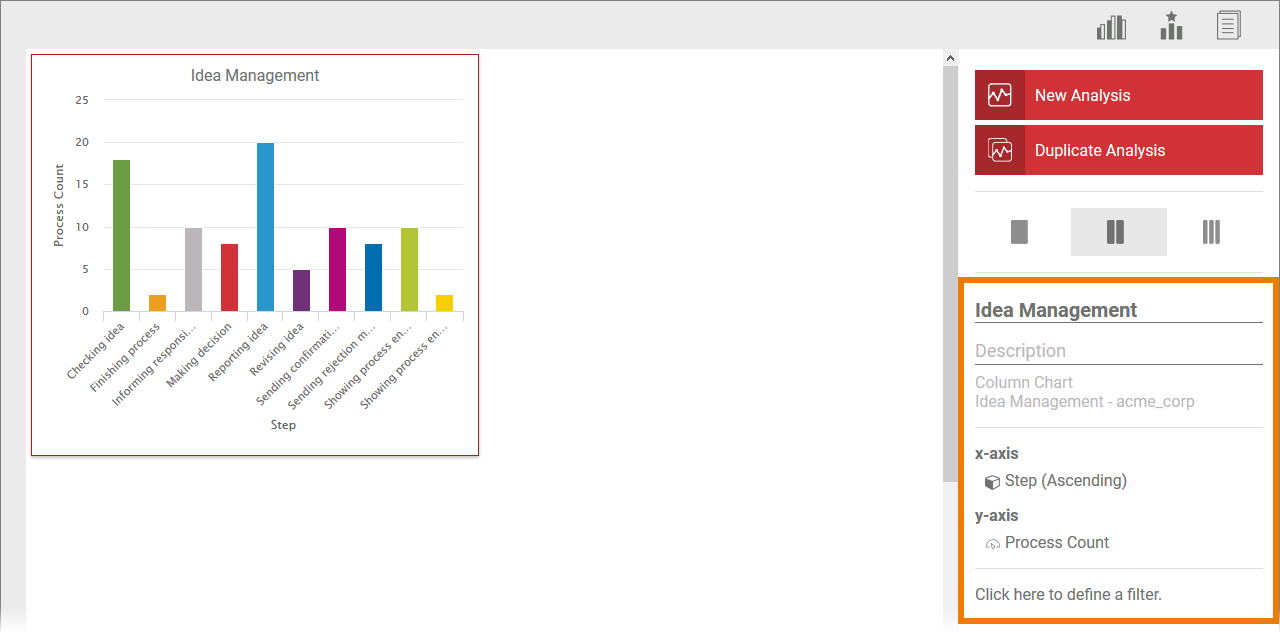
Select a chart on the user interface to display the basic data of the analysis in the Analysis Sidebar:
| Multiexcerpt include | ||||||
|---|---|---|---|---|---|---|
|
Editing the Properties of an Analysis
The basic data of the analysis can be edited directly via the sidebar.
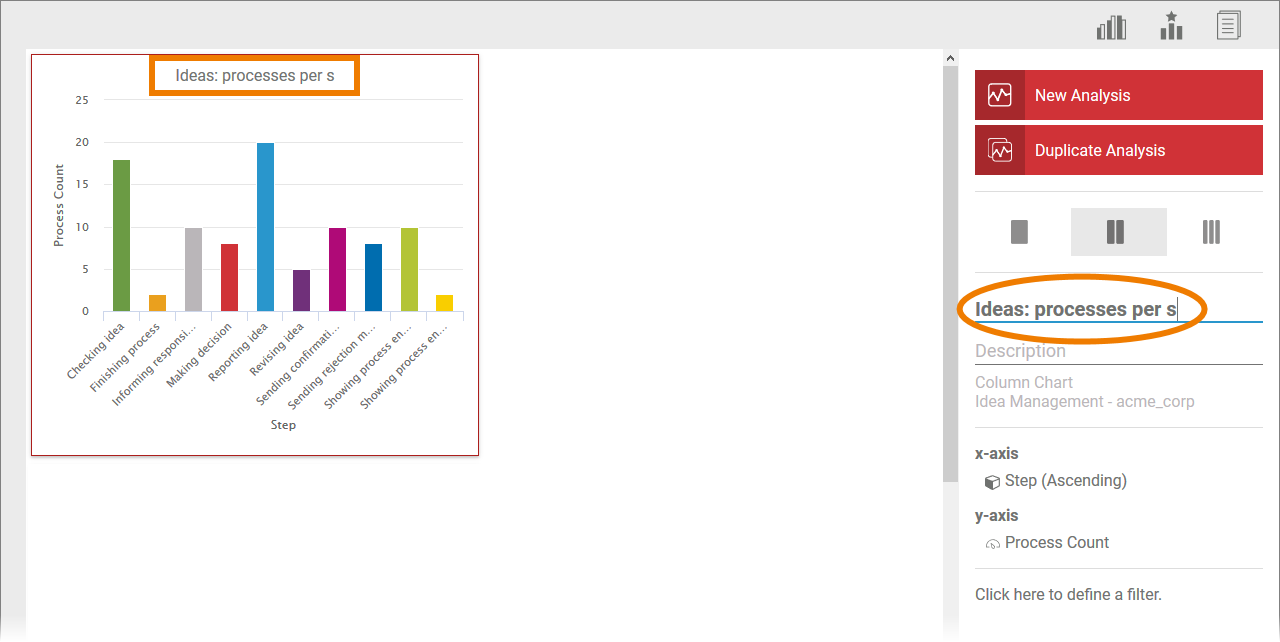
Naming the Analysis
Click in the box to enter a title for the analysis. The name is shown above the graphic.
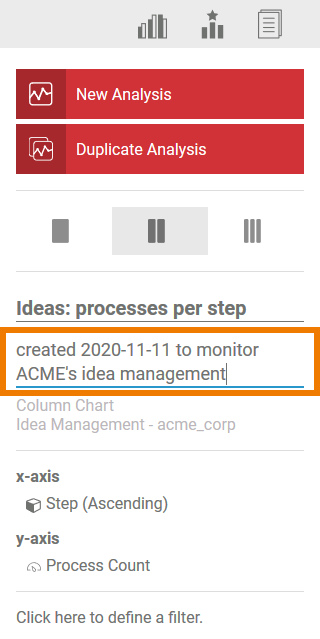
Describing the Analysis
| The analysis can be described in more detail in this field. Click on the description field to edit it. Below the description, two additional pieces of information are displayed in read-only mode:
|
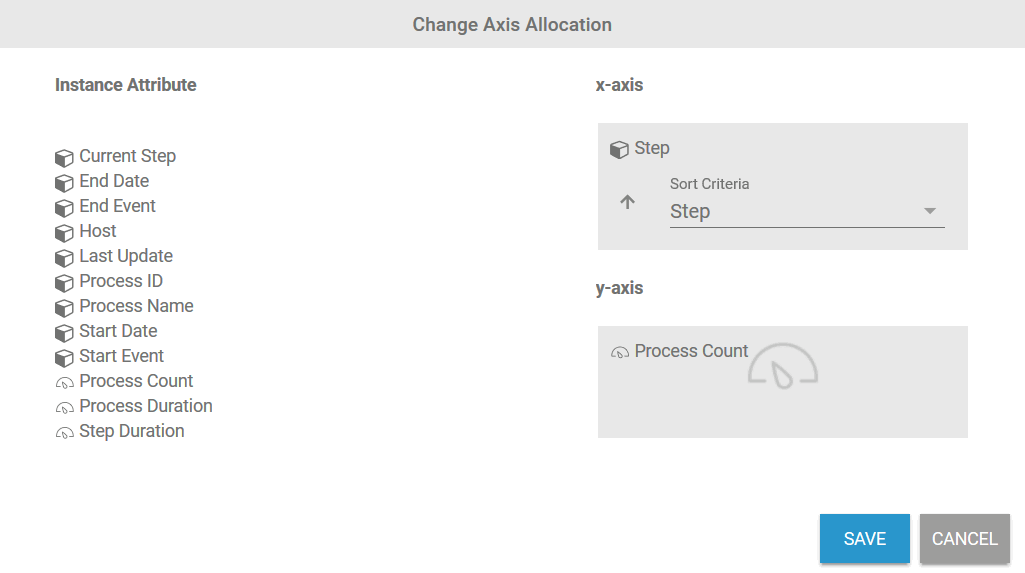
x-Axis/y-Axis
| Clicking this area opens a separate window in which the axis allocation selected can be changed.
|
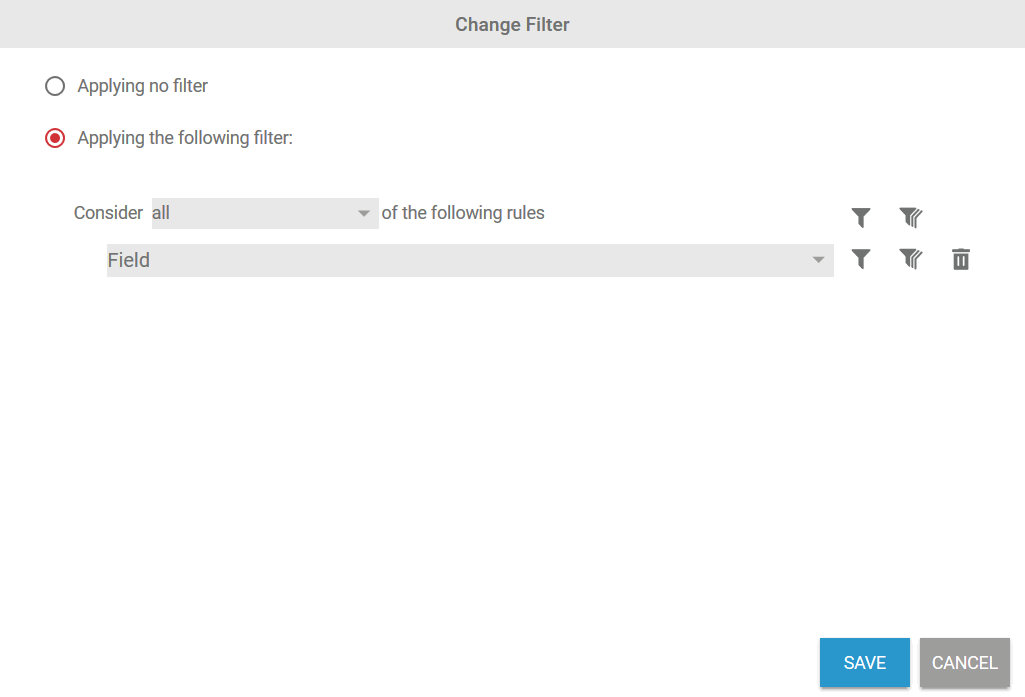
Filter
| This area is used to open and edit filter settings for the analysis.
|
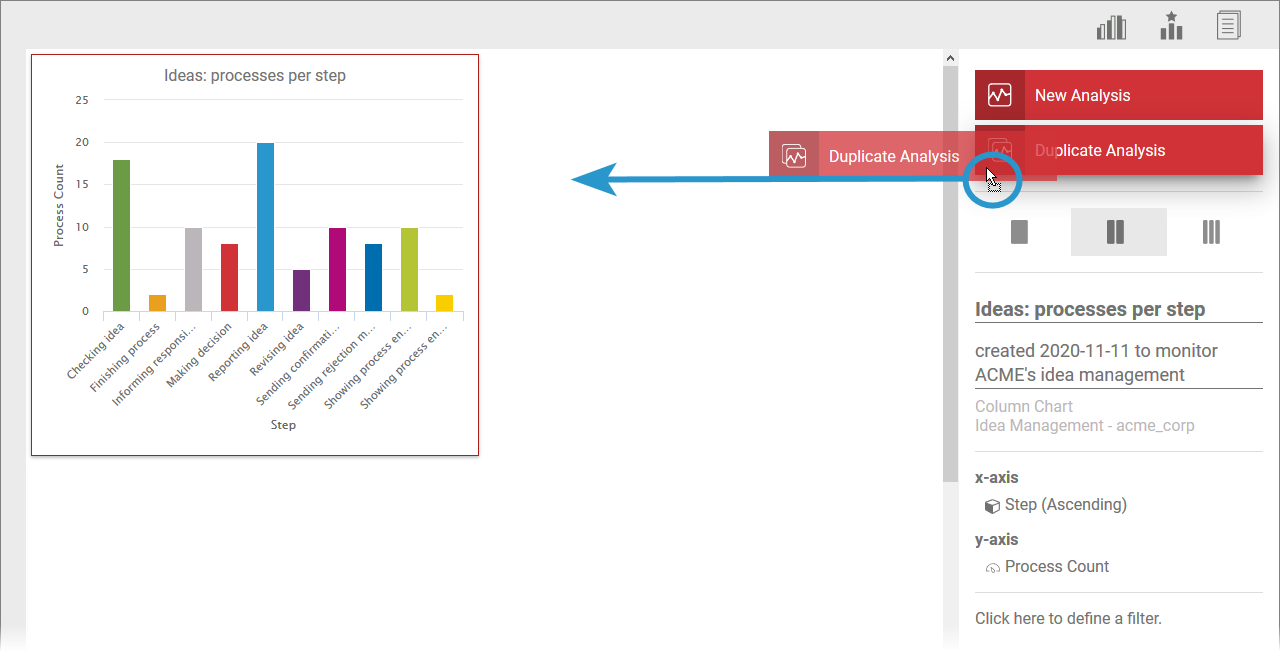
Duplicating an Analysis
Once an analysis has been marked, you can also copy this analysis via the sidebar. To do this, drag the Duplicate Analysis link onto the user interface:
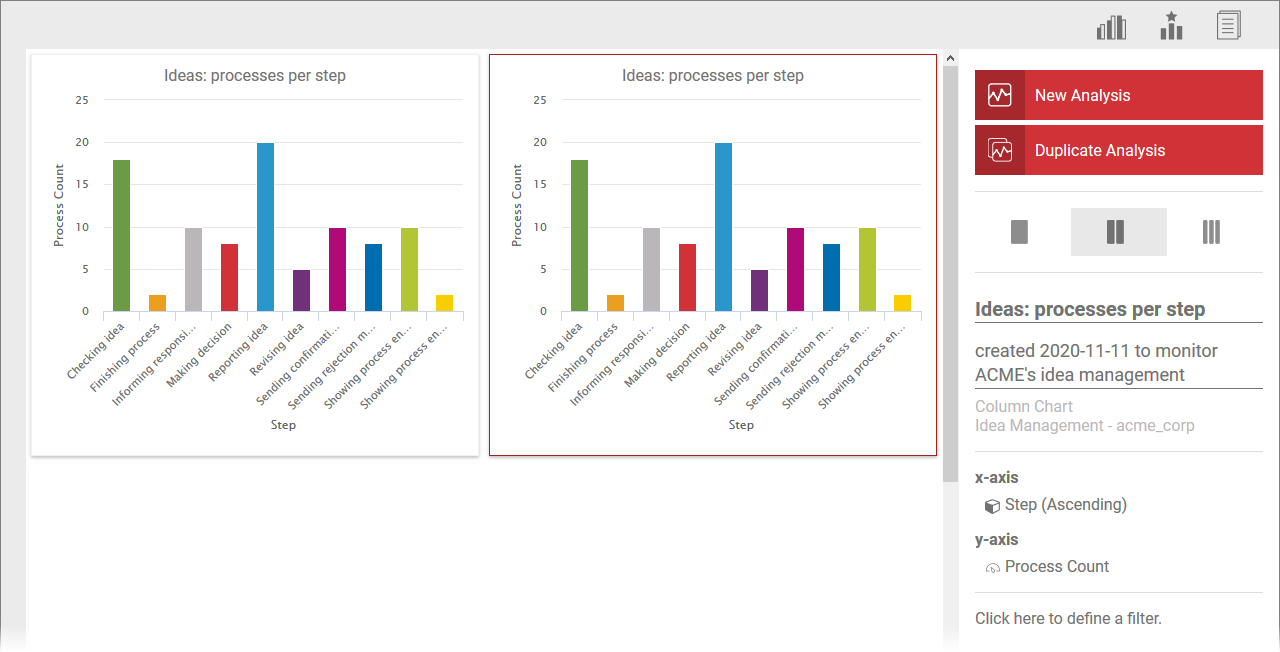
The Create Analysis wizard opens (for further information visit the Creating an Analysis page). You can change the analysis settings here or create an exact duplicate by clicking the Duplicate Analysis button.
The copy is created on the user interface and can be edited as usual via the Analyses Sidebar:
| Otp | ||||
|---|---|---|---|---|
|
| Rp |
|---|
Overview
Content Tools