Page History
| Div | ||||||
|---|---|---|---|---|---|---|
| ||||||
|
| Multiexcerpt | ||
|---|---|---|
| ||
The Process Dashboard is the interface where you can inspect the details of a BPMN process, that have been collected by the Data Collector services. The collected data is presented in table form or in chart form. |
Besides the standard BPMN process details as processID, start time, end time, duration and so on that are present in the Dashboard database, you can also implement and query custom values. How to implement custom values is described on Logging Custom Values to the Dashboard Database.
The Elements of the Process Dashboard UI explained
The Process Dashboard UI consists of three areas:
a query area on the top
Via the elements of the query area, you can narrow down the information shown in the data area below. You can filter the displayed data and create own views.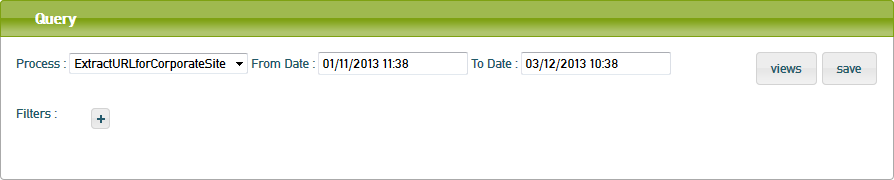
a data area in the middle (containing the tabs List, Process Duration, Start Event, End Event, State Duration and Custom).
The data area displays the collected service data as selected from the query area. You can switch between the tabs to inspect divergent charts on the selected data.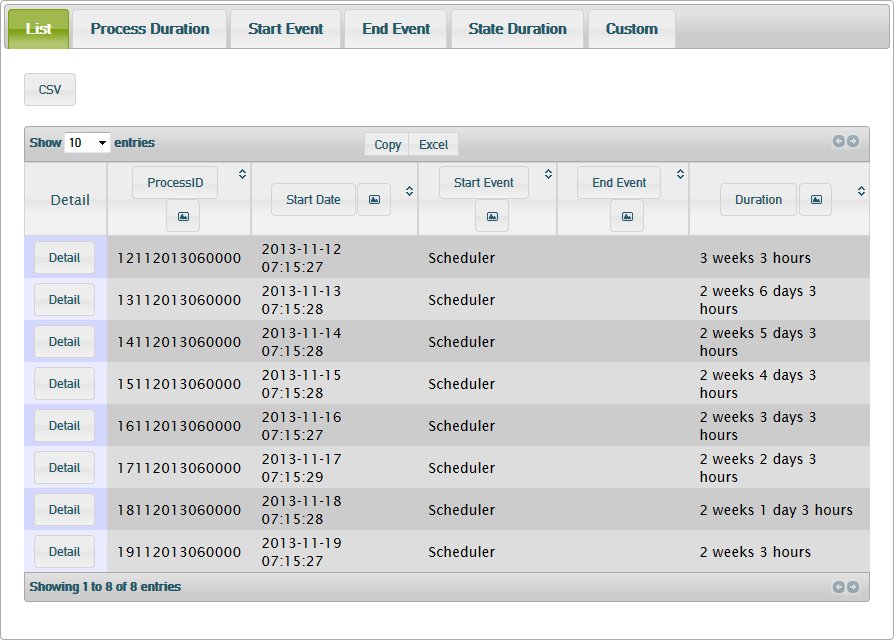
a BPMN area at the bottom.
In the BPMN area, the BPMN diagram of the selected process is displayed (if it has been deployed together with the corresponding service).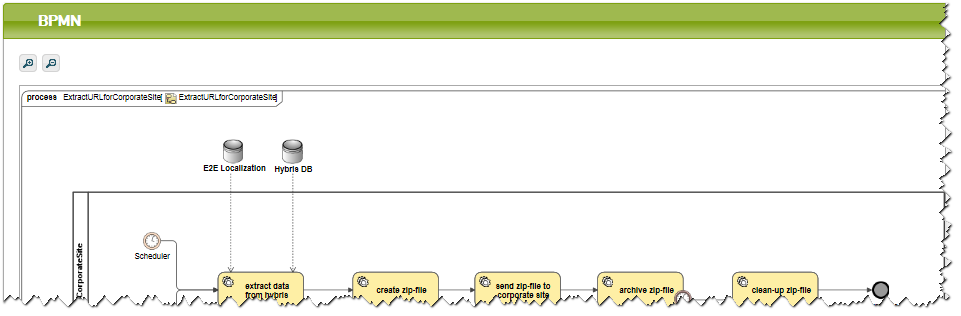
| Panel | ||||
|---|---|---|---|---|
| ||||
|
Overview
Content Tools